

Intel Processor Trace is a hardware technology that can record all program execution flow along with timing information accurate to around 30ns. As far as I can tell almost nobody uses it, seemingly because capturing the data is tricky and, without any visualization tools, you’re forced to read enormous text dumps.
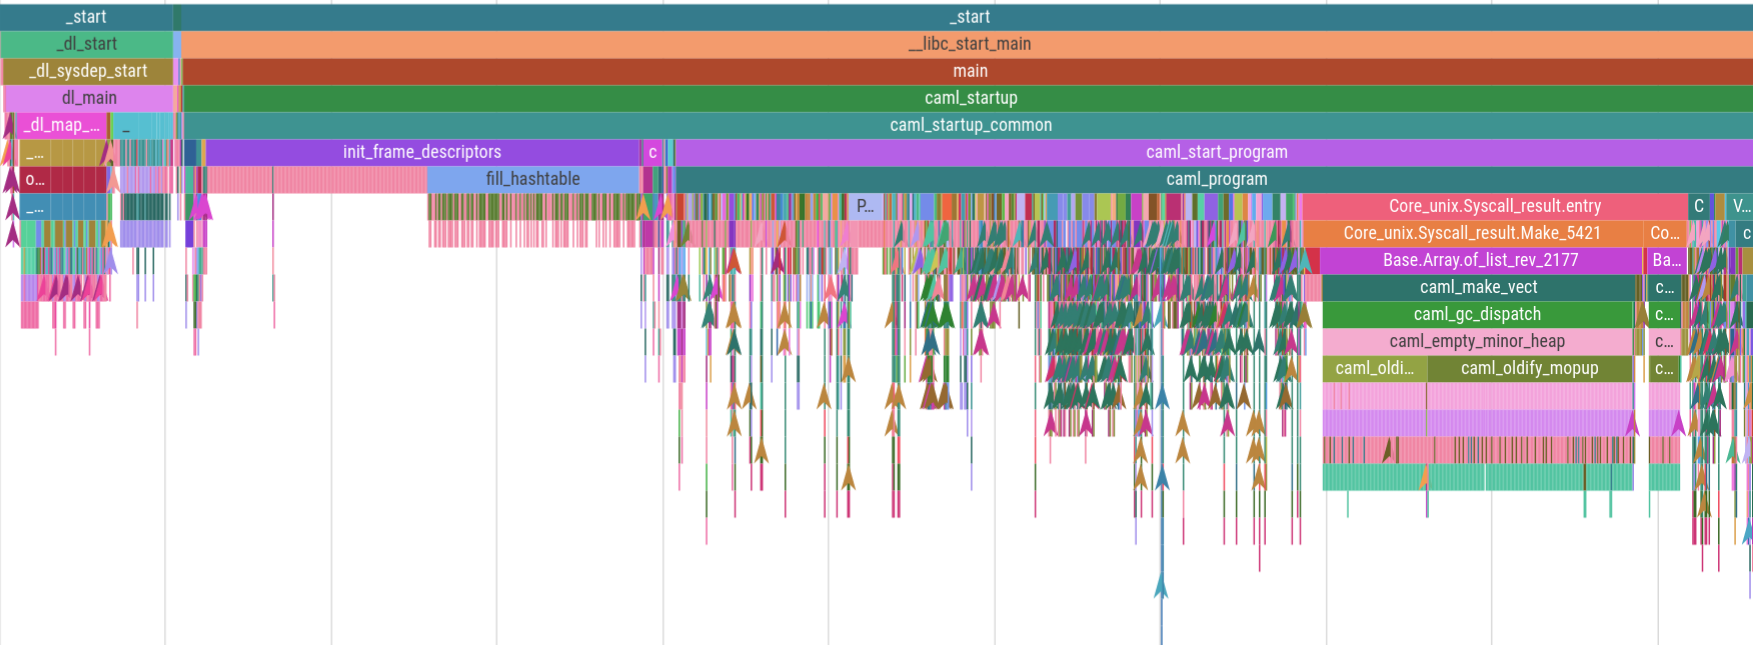
Magic-trace is a tool we built and open-sourced to make it easy to capture a trace of around 10ms leading up to a function call you chose to instrument, and then visualize the call stack on a timeline where you can zoom in and see every function call and how long it took. Here’s a captured trace of 5ms of OCaml program startup:
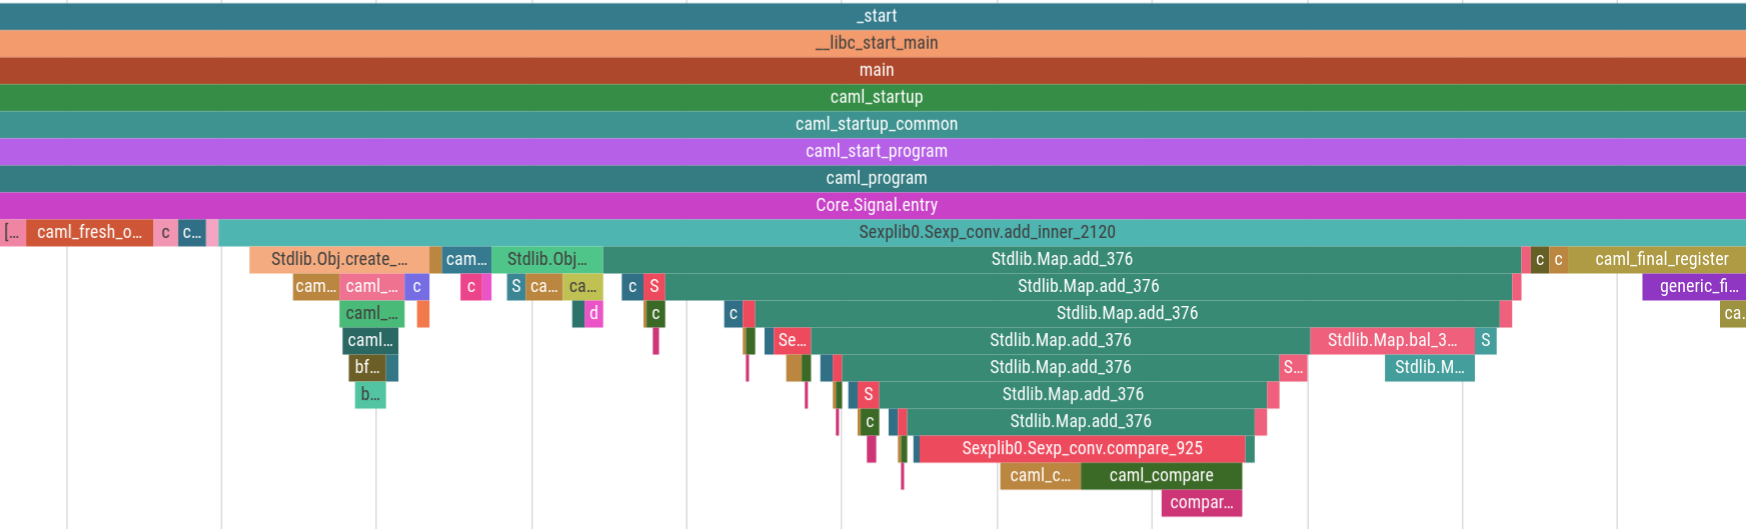
And here’s the same trace zoomed in to an arbitrary 500 nanoseconds. The thin red events are 1-3 nanoseconds:
Recently we’ve been using this tool to diagnose performance issues that
would be very difficult to solve with other tools. Using it is as easy
as adding a Magic_trace.take_snapshot call to your code (or using a
fuzzy-finder to select any existing function), then running
magic-trace attach and using the fuzzy-finder to select your process.
It’ll spit out a trace you can view in Google’s Perfetto trace
viewer.
In this post we’ll go over why Processor Trace is so special, the difficulties of building something on top of a hardware technology almost nobody uses, how we were beset by a kernel bug and a hardware bug, and the kinds of problems we’ve been able to solve with the tool.
Why Intel Processor Trace, and why not?
Let’s look at the major types of performance analysis tools and why magic-trace serves a different niche:
Sampling profilers interrupt the program every 250 microseconds or so, sample the current call stack, and then summarize them all together. These are great for giving you a sense of where your program is spending its time. However, at Jane Street we have lots of high-performance trading systems that spend nearly all of their time waiting for network packets that we want to respond to in far less than the 250-microsecond sampling interval. Sampling profilers are approximately useless for diagnosing latency issues on that scale: you’d be lucky to get one sample in the code you care about!
Even in more traditional systems, you may want to diagnose short but rare tail latency events, or notice the difference between a function being called 10 times more than you expected or one call to it taking 10 times longer than expected, which a sampling profiler can’t tell you.
Instrumentation-based tracing either patches or compiles probes into a program that record when certain functions start and end, then typically visualizes them on an interactive timeline UI. We re-use the UI from the Perfetto tracing system for magic-trace, although we needed to fork it to better handle events at the scale of single nanoseconds. High-performance tracing systems like tracy even manage to get the overhead down to around 2ns per call (we built a similar system for OCaml and open-sourced it). However, instrumenting every single function is risky (e.g. you might triple the cost of a 1ns function that’s called everywhere) so typically they require manual instrumentation, and sometimes your performance problems are in an app or function you haven’t annotated.
Hardware tracing like Intel Processor Trace (IPT) has the advantages of tracing but doesn’t require any instrumentation, and can have much lower overhead than instrumenting everything. They use a very efficient format that only encodes just enough info to reconstruct the control flow – for example conditional branches take one bit. Time overhead for IPT varies from 2-20% depending on the program, with every one of our programs I’ve benchmarked experiencing less than a 10% slowdown and usually under 5%.
There are a few downsides to Processor Trace though:
- Many VMs don’t support it and it needs a post-Skylake Intel processor (some other vendors have similar tech; AMD doesn’t yet).
- You have no choice but the full 1GB/s firehose (with the exception of some limited filtering options) so it’s difficult to store and analyze longer traces. With instrumentation you can manually pick the important functions and economize on trace size.
- Decoding is slow because it needs to follow along with disassembled instructions from the binary and reconstruct the flow. Other than specialized decoders for fuzzing, the fastest decoder is 60x slower than real time.
A minimum viable product
During Jane Street’s 2021 summer internship, I was talking to some colleagues about our issues profiling very short interesting time segments. I noted that Intel Processor Trace would be great for this but that it was really hard to use. Then I realized that with the trace visualization library I had just written, and some features from the Processor Trace documentation I had just read, I could see a path to a user-friendly tool. So I drafted a new intern project document, and for the second half of his internship, Chris Lambert and I worked on putting it together.
The key idea behind quickly making a useful tool was to limit the scope:
- We’d focus on the circular buffer mode, where it overwrites old data until you snapshot it after something interesting happens. Processor Trace can save all data, but doing so creates 1GB of trace file per second.
- We’d trigger the snapshots based on a function call in the target program. There are lots of other possibilities for deciding when to snapshot, but calling a function is very flexible, especially if you put it behind custom logic waiting for tail latency events or something.
- We’d only visualize function calls and returns, and only on a trace timeline. Processor Trace gives you full control-flow data and in theory you could visualize down to individual lines, but that ends up being too much data to deal with.
The first stage was to implement the tool as a wrapper around the
Linux perf tool’s Processor Trace functionality, and Chris blazed
through it in under a week. Sending the SIGUSR2 signal to perf
caused it to take a snapshot, so Chris wrote a
Magic_trace.take_snapshot function that sent SIGUSR2 to the parent
pid. Then he wrote a parser and call-stack reconstructor to turn the
perf script text dump of all branches into a trace that handled
OCaml features like tail-calls and some exceptions.
It was pretty exciting looking through the first traces and being able to zoom in and see the smallest details, and immediately noticing things like that OCaml program startup time was mostly composed of module initializers page faulting in random parts of the binary.
Directly using kernel APIs and libipt
Then we embarked on something harder. Parsing the output of the perf
tool was slow and couldn’t do the instruction-level decoding needed for
properly handling pushes and pops to the OCaml exception handler stack.
We decided to try directly using the kernel perf_event_open API
and Intel’s libipt decoding library.
This turned out to be quite tricky, as we couldn’t find any evidence
anyone had ever tried directly integrating perf_event_open with
libipt before. I ended up spending my days poring over documentation
and source code of libipt and the perf tool to figure out how to
do things we hadn’t understood yet and handing answers and example
links over to Chris, who wrote and debugged the C code to interface
with the APIs and with OCaml.
After lots of research and debugging, by the end of his internship we’d managed to get a trace of events out of our from-scratch implementation. After Chris left I debugged the remaining issues and plumbed it in fully. Hopefully now that we’ve published a reference codebase, anyone else attempting this will have an easier time.
Hardware breakpoints for seamless triggering
After Chris left and things were working, the biggest feature that we
needed to make useful and easy was the ability to attach to existing
processes. Unfortunately this broke our parent-SIGUSR2-based
snapshot signalling. I wanted Magic_trace.take_snapshot to have close
to zero overhead while magic-trace wasn’t attached, and low overhead
even when it did trigger a snapshot. I thought I might have to have
every process host a tiny IPC server or use ptrace, but I
wasn’t happy with those solutions.
I spent a bunch of time looking for a better solution and eventually I
found a really satisfying one in the perf_event_open docs. It
turns out that perf_event_open can use hardware breakpoints and
notify you when a memory address is executed or accessed.
The cool thing about this approach is that it requires no cooperation
from the target, no overhead when not attached, and can actually be
used on any function we want, not just a special
Magic_trace.take_snapshot function. When we do use it on a special
function, we can sample registers so we can see the arguments it was
called with, allowing the user to include metadata with their
snapshot.
I think it says something interesting about my programming aesthetic
that I spent a whole day researching alternatives to adding a tiny IPC
server and ended up using a niche kernel API and hardware feature. I
knew the hardware allowed a design which didn’t require recompiling or
adding extra bloat to processes that weren’t being traced, and I really
wanted to make first-time use as smooth as possible and avoid bloating
everyone else’s programs. If I did go the IPC route, I was at least
going to use less-obscure-but-still-rare Linux-only abstract domain
sockets (named by the PID) to avoid having to clean up files or deal
with ports. Sometimes standard approaches can’t get you to an ideal
user experience, but they’re easier for your coworkers to maintain, you
run into fewer issues, and need to do less research. This tradeoff
leaves low-hanging fruit for people who enjoy diving deep into obscure
documentation and debugging weird issues, which can tip the balance.
Hardware breakpoints, the whole magic-trace project, and other
projects of mine are all the result of delighting in asking myself
“could I obliterate this problem by being willing to do cursed things?”
Kernel bugs and hardware bugs, the perils of being early
People have sometimes used Processor Trace, and it mostly works, but I’ve learned that when using niche and complicated new hardware, I can’t have the same low priors as I usually do about bugs being due to the kernel or hardware.
I was excited to be able to try my hand at kernel debugging for the first time when I discovered a way to crash the kernel using a specific unusual combination of Processor Trace features. I used info from the kernel core dump, and read through control flow paths and recent patches in the kernel, to figure out the reason for the null pointer access. It turns out a patch added a flag that made one piece of state invalid to access, but missed guarding it with an if statement in one place. Exactly the kind of bug that algebraic data types in OCaml/Rust/etc help you avoid :)
Another bug was much more mysterious and difficult. On exactly one
program out of any I tried, Processor Trace would mysteriously stop
adding events to the trace buffer before it reached the snapshot
point. I spent 2 weeks adding various sorts of observability and
fixing other issues that got in the way (so at least magic-trace
ended up better regardless), and couldn’t find any sensible software
cause, e.g. a context switch that lined up with when the recording
stopped. Finally I tried running it on a newer generation of Intel
processors and the problem went away. I suspect it may be Intel
erratum SKL171 “Intel® PT May Drop All Packets After an Internal
Buffer Overflow” which happens under a “rare microarchitectural
condition”, although it still might be some race condition kernel bug
that’s very consistent only in the older hardware.
Solving tricky problems
People have only been using magic-trace internally for about a month
but we’ve already made good use of it.
The original design goal was to help with performance problems in high-performance trading system that sampling profilers are hopeless for, and that’s panned out. It helped identify a 100ns performance regression caused by a patch that turned out to cause a function call not to be inlined. It also helped diagnose why a new compiler version made a trading system slower, which also turned out to come down to an inlining decision.
But after we built magic-trace, we realized it could help with another
kind of difficult performance problem that people at Jane Street
encounter frequently. We use Async to cooperatively handle many
concurrent tasks. The “cooperatively” part means that if one task
takes too long then all other tasks have to wait for it. If you have
an issue that causes a task to handle way more work than usual, it can
cause a “long async cycle”. These can be really tricky to debug if
they only happen occasionally, since you don’t get any info about what
code was too slow. Previously people have resorted to capturing
enormous long perf profiles and then using logged monotonic
timestamps to filter the profile to the relevant region.
Now with magic-trace people can just add a snippet of code that
calls Magic_trace.take_snapshot after cycles over a certain length,
and then attach magic-trace and wait for it to capture. Even if a
long cycle is 15 seconds, the last 10 milliseconds of the job are
normally the same uniform large batch of work, so you can just look
back in the trace to see which code is doing too much work. We’ve
already used this to solve one tricky issue where there were way more
items in a certain collection than expected and a loop was spending
seconds working over them. Sampling profile filtering would’ve been
harder and wouldn’t have been able to tell whether the function was
looping too many times instead of, say, taking a really long time once
or just always being somewhat slow.
Even if magic-trace is only indispensable for certain
high-performance code, as a user-friendly performance tool in a
toolbox it can be useful for all sorts of debugging and performance
problems just by being quicker and easier to use than alternatives.
How you can use magic-trace
We designed magic-trace for our own OCaml code but now you can use it on any native executable with symbol names (e.g. a C++ or Rust program) as long as you have a new enough Intel Linux machine. Here’s how:
# If this prints 1 your machine supports Processor Trace with precise timing
cat /sys/bus/event_source/devices/intel_pt/caps/psb_cyc
# Install Opam (https://opam.ocaml.org/doc/Install.html), then OCaml 4.12.1
opam switch create 4.12.1
opam switch 4.12.1
# Add the Jane Street pre-release repo, magic-trace isn't on public Opam yet
opam repo add janestreet-bleeding https://ocaml.janestreet.com/opam-repository
# Install the magic-trace command line tool
opam install magic-trace
# This lets you fuzzy-search a process to attach to and a symbol to snapshot on
magic-trace attach -symbol '' -output magic.ftf
# Go to https://ui.perfetto.dev/ and open the trace file
Nobody else has used Perfetto for traces like this before so we also needed to leave our OCaml and C extensions to the land of Typescript and patch Perfetto to support zooming to nanosecond-levels. The main Perfetto UI works, and we hope to upstream some patches to it, but for the best experience you can build the UI from our fork.
Let’s use more Processor Trace!
Intel Processor Trace is an incredibly powerful and cool technology, and
it’s an absolute shame that more people don’t use it. I hope that
magic-trace shows people how useful Processor Trace and technologies
like it can be, and makes it easier to use Processor Trace by providing
an example codebase.
One way to build tools on top of Processor Trace that I haven’t
mentioned yet is perf-dlfilter, which allows you to consume
perf events using an efficient C API with a shared library rather
than parsing text output. We didn’t use it because it was just being
submitted to the kernel as we were writing magic-trace; we didn’t
learn about it until I stumbled upon it months later. I’d recommend
that tools try to start with perf and dlfilter rather than
perf_event_open and libipt, as it just implements tons of stuff
you’ll otherwise need to reimplement.
At the end of his internship, Chris even suggested that with hindsight
we should have forked perf to add a C interface rather than
embarking on the libipt route – and luckily someone else did, with
the specific goal of efficiently reading Processor Trace events! You
don’t even need a super new kernel, because you can compile the perf
tool from a newer kernel tree and use it on an older kernel.
Here are some more ideas we’ve thought of for Processor Trace tooling
that nobody’s built yet and that we might build into magic-trace:
- Visualizing control flow at the level of individual lines of code, perhaps with a custom trace viewer designed for Processor Trace which lazily decodes the lowest levels again as you zoom in.
- Feedback Directed Optimization of low-latency systems by optimizing based on recorded control flow in the latency-critical case.
- Using Processor Trace to evaluate compiler optimizations by counting the number of actually executed register spills, page faults, etc. on benchmarks.
- Building efficient instrumentation-based tracing on top of the
PTWRITEinstruction in the latest processors, which allows adding data into the trace. - Using the “PEBS via PT” feature on very new processors to sample cache misses or branch mispredicts and add them to the trace so you can notice why your function is slow.
- Using root permissions to record every process on every core plus the kernel and combining it with task switch information to visualize literally everything the processor was doing during a time slice so mysterious performance problems have nowhere left to hide.
If more people use Processor Trace, more VM hypervisors will support
it, Intel will hopefully invest more in it as a differentiating factor,
and perhaps AMD will try to catch up. And if you want to use Processor
Trace today, try magic-trace on your own problems, or apply to Jane
Street and come try it on ours: we’re always hiring!