

Jane Street does a lot of network maintenance over the weekends. In each maintenance, a cabinet may lose connectivity for 15 to 25 minutes. Our internal Kafka infrastructure is supposed to be resilient to these partitions, and reconnect when connectivity resumes. For several months this year, it didn’t: processes segfaulted, leaked hundreds of thousands of sockets, or crashed in a surge of half a million TCP connections.
The investigation uncovered six bugs across glibc, our OCaml networking stack, Async, our Kafka client, and a job runner. Two had been present for more than a decade.
- glibc has an eleven-year-old bug where a failed resolver re-initialization leaves the DNS resolver in a state that segfaults on the next lookup.
- Our socket library leaks a UDP socket when
bindfails under ephemeral-port pressure. - Async, our open-source concurrency library, has a fourteen-year-old regression:
Tcp.connect_sock’s timeout stopped covering DNS resolution, so a connection attempt stuck in name resolution never times out. - Our Kafka client’s request retry loop times out without aborting the underlying attempt.
- Our Kafka client’s bootstrapping logic can duplicate concurrent lookups: clients locate brokers through an in-house discovery service, and simultaneous requests for the same endpoint each perform their own lookup, DNS included.
- A job runner migration silently stopped applying our file-descriptor limit overrides, cutting the limit by a factor of eight.
Each bug hid behind the previous one: investigating the crash exposed the leak, and fixing the leak revealed the recovery-time connection surge. This post follows the order in which we found them. There are a few lessons at the end, but mostly this was a fun saga that I wanted to share.
Table of contents
- Background: the cast of characters
- Act I: The segfaults
- Act II: The file-descriptor leak
- Act III: The thundering herd
- Why did this start in April?
- How it all fits together
- The fixes
- Lessons
Background: the cast of characters
This story crosses a lot of layers, so some context on the moving parts.
Kafka relays and consumer-group monitors. These are two of our Kafka support processes: relays copy messages between different Kafka clusters, and consumer-group monitors track how far Kafka consumer groups have progressed. We run dozens of them per host (79 on the box in one of the incidents below). To do their jobs, each one keeps pools of live connections open to many brokers, both upstream and downstream, and continually refreshes broker metadata and re-resolves hostnames as membership and leadership shift around. So even on a calm day, a single box holds a lot of sockets and does a steady stream of DNS lookups.
Two different DNS paths. OCaml code at Jane Street resolves hostnames through two independent code paths and a single process routinely uses both:
- The glibc resolver, via
{Core,Async}_unix: this isUnix.Host.getbynameand friends, which ultimately call glibc’sgethostbyname_ron the Async thread pool. - dns-lib, an in-house OCaml DNS client, used by our service-discovery layer among other things. It builds its own UDP sockets and talks to nameservers directly.
The Async DNS throttle. A few years ago, some of our monitoring servers crashed in
another network maintenance because DNS resolution blocked the entire Async thread pool
while DNS was unreachable. As a result, Async started putting all glibc DNS lookups
behind a throttle capped at half the
pool,
so when DNS is unhealthy the lookups queue rather than starving everything else of
threads. Unlike the glibc path, dns-lib does not go through this throttle.
Ephemeral ports are a box-wide resource. The ephemeral range on these boxes is the
kernel’s default
setting
net.ipv4.ip_local_port_range = 32768 60999: that’s 28,232 ports shared across all
processes on the box. Exhaust them and bind(0.0.0.0:0) starts failing with EADDRINUSE.
The two DNS paths therefore fail differently during a network partition. With that, let’s watch a maintenance go wrong.
Act I: The segfaults
In April, several relays and consumer-group monitors segfaulted during maintenance and dumped core. Every coredump had the same shape:
#0  0x00007ffff3e07ed7 in sock_eq () from /lib64/libresolv.so.2
#1  0x00007ffff3e08bb7 in __res_context_send () from /lib64/libresolv.so.2
#2  0x00007ffff3e067dd in __res_context_query () from /lib64/libresolv.so.2
#3  0x00007ffff3e06e76 in __res_context_querydomain () from /lib64/libresolv.so.2
#4  0x00007ffff3e0745f in __res_context_search () from /lib64/libresolv.so.2
#5  0x00007fffea6023c0 in gethostbyname3_context () from /lib64/libnss_dns.so.2
#6  0x00007fffea602ecf in _nss_dns_gethostbyname_r () from /lib64/libnss_dns.so.2
#7  0x00007ffff434fa53 in gethostbyname_r@@GLIBC_2.2.5 () from /lib64/libc.so.6
#8  0x000000000bfbc12e in caml_unix_gethostbyname (name=<optimized out>) at gethost.c:161
We crashed inside glibc’s DNS resolver, in sock_eq, dereferencing a null pointer:
Program received signal SIGSEGV, Segmentation fault.
#0  0x00007ffff3e07ed7 in sock_eq (a1=0x7fffca3ffdcc, a2=0x0) at res_send.c:1453
1453		if (a1->sin6_family == a2->sin6_family) {
glibc had read a null nameserver address: a2 was 0x0.
An eleven-year-old bug
A little resolver anatomy first. The public statp->nsaddr_list[] is the resolver’s
original nameserver list, but it’s typed sockaddr_in (IPv4 only). To support IPv6
nameservers without changing that struct’s layout (old binaries depend on it), glibc keeps
a separately-allocated extended copy off to the side, statp->_u._ext.nsaddrs[]. This
is an array of sockaddr_in6 * that can hold either family, with its own count
statp->_u._ext.nscount. It builds this copy lazily and, in __res_context_send,
re-validates it against the public list on every send (an application can rewrite
nsaddr_list between calls). That validation loop assumes: if nscount != 0, then every
entry in nsaddrs[] up to nscount is a valid pointer. When it walks the list it calls
sock_eq on each nsaddrs[ns].
In the coredump, that invariant was broken:
(gdb) p statp->nscount
$1 = 3
(gdb) p statp->_u._ext.nscount
$2 = 3
(gdb) p statp->_u._ext.nsaddrs[0]
$3 = (struct sockaddr_in6 *) 0x0     # nscount says 3, but the pointers are NULL
(gdb) p statp->_u._ext.nsaddrs[1]
$4 = (struct sockaddr_in6 *) 0x0
(gdb) p statp->_u._ext.nsaddrs[2]
$5 = (struct sockaddr_in6 *) 0x0
nscount == 3, but all three nsaddrs pointers are null. The validation loop calls
sock_eq(&valid, NULL) and crashes.
Searching for that signature turns up glibc bug
23005, and at first it looks like
an exact match: same function, same null a2, same crash site in res_send.c, and a
mechanism that fits. When __res_context_send fails to allocate its private copy of
nsaddr_list, it can leave nulls behind and crash on the next call. The
fix
is a couple of lines of error handling.
That fix shipped in 2.28 and was already included in the version we run.
That’s not our bug!
We eventually traced it to a 2015 glibc
commit (affecting
glibc 2.22 through 2.43) that moved the “cache is valid” flag from _u._ext.nsinit to
_u._ext.nscount. The commit removed the nsinit cleanup in __res_iclose but never
added the corresponding nscount cleanup:
@@ -621,8 +604,6 @@ __res_iclose(res_state statp, bool free_addr) {
                                statp->_u._ext.nsaddrs[ns] = NULL;
                        }
                }
-       if (free_addr)
-               statp->_u._ext.nsinit = 0;
 }
So __res_iclose can null out the nsaddrs[] pointers while leaving nscount nonzero.
The relevant caller here is res_init. It closes with free_addr = true and then
immediately calls __res_vinit to rebuild the state:
  else if (_res.nscount > 0)
    __res_iclose (&_res, true); /* Close any VC sockets.  */
  ...
  return __res_vinit (&_res, 1);
The bug only bites if __res_vinit fails: for example, fopen("/etc/resolv.conf")
returning EMFILE under file-descriptor exhaustion, or a malloc failure under memory
pressure. Then res_init returns having torn down the old state but not built the new
one, leaving nsaddrs[] = NULL with nscount = 3. The next gethostbyname on that
thread segfaults.
Reproducing it
We can reproduce this in C in three steps: resolve once, cap the FD limit so re-init fails, then resolve again.
int main() {
  gethostbyname("host-a.example.com");           // works, initializes resolver

  struct rlimit rl;
  getrlimit(RLIMIT_NOFILE, &rl);
  rl.rlim_cur = 3;
  setrlimit(RLIMIT_NOFILE, &rl);                 // now re-init can't open resolv.conf

  res_init();                                    // fails halfway, corrupts state
  gethostbyname("host-b.example.com");           // segfault
}
We normally don’t call res_init ourselves in {Core,Async}_unix, but dns-lib
does. Even though dns-lib does actual DNS resolution in OCaml, it calls glibc res_init
to parse /etc/resolv.conf. So the sequence that corrupts the resolver is a collaboration
between the two libraries, on the same OS thread:
Async_unixdoes a successful glibc lookup (initializes_res).dns-libcallsres_init, which fails under FD/memory pressure and corrupts_res.Async_unixdoes another glibc lookup on that same thread, and segfaults.
The catch is step 3 has to land on the same Async worker thread as step 2 (resolver
state is per-thread). In production that’s a matter of luck: Async spreads In_thread
work across a 50-thread pool. But we can force it, and reproduce the crash reliably in
OCaml, by pinning the pool to a single thread:
let host = "host-a.example.com" in
let%bind async_result1 = Unix.Host.getbyname host in
let%bind () = Scheduler.yield_until_no_jobs_remain () in
Debug.eprint_s [%message "async result 1" (async_result1 : Core_unix.Host.t option)];
let old_limit = Core_unix.RLimit.get Core_unix.RLimit.num_file_descriptors in
Core_unix.RLimit.set
  Core_unix.RLimit.num_file_descriptors
  { old_limit with cur = Limit 3L };
let%bind () = Scheduler.yield_until_no_jobs_remain () in
let%bind dns_lib_result = Dns_lib.resolve host in
Debug.eprint_s
  [%message "dns lib result" (dns_lib_result : Core_unix.Inet_addr.t list Or_error.t)];
let%map async_result2 = Unix.Host.getbyname host in
Debug.eprint_s [%message "async result 2" (async_result2 : Core_unix.Host.t option)]
$ ./repro.exe
("async result 1"
 (async_result1
  (((name host-a.example.com) (aliases ()) (family Inet)
    (addresses (192.0.2.65))))))
("dns lib result"
 (dns_lib_result (Error "DNS: No nameservers found! Check /etc/resolv.conf")))
("async result 2" (async_result2 ()))

$ ASYNC_CONFIG='((max_num_threads 1))' ./repro.exe
("async result 1"
 (async_result1
  (((name host-a.example.com) (aliases ()) (family Inet)
    (addresses (192.0.2.65))))))
("dns lib result"
 (dns_lib_result (Error "DNS: No nameservers found! Check /etc/resolv.conf")))
Segmentation fault (core dumped)
EXIT STATUS 139
We filed the bug; our fix is now
committed upstream in
glibc
and shipped in
2.44,
making res_init handle the failure gracefully instead of leaving a half-initialized
resolver behind.
And this one turned out to be bigger than just Kafka. When we searched our coredump
history for the same sock_eq/libresolv segfault signature, it had been crashing
unrelated systems across the firm (trading apps, research jobs, other infrastructure, and
even Chrome!) for years.
The reproduction required FD or memory pressure. The glibc bug explained the crash, but
not why res_init had failed. The next maintenance window supplied that answer.
Act II: The file-descriptor leak
During the next maintenance in May, our host monitoring flagged consumer-group monitors
sitting at more than 90% of their 32,768 FD limit and still climbing. Nothing crashed this
time, but something was clearly leaking. lsof attributed the growth to UDP sockets:
$ lsof -P -p 44126 | wc -l
30607
$ lsof -P -p 44126 | rg UDP | wc -l
30469
Thirty thousand UDP sockets in one process. These weren’t normal bound sockets either:
lsof listed them as bare sock entries with protocol: UDP, i.e., sockets that had
been created but never bound.
A socket-then-bind leak
Chasing where these came from led to our socket library, which creates a UDP socket and then binds it:
let file_descr = socket ~kind:SOCK_DGRAM in
...
Core_unix.bind file_descr ~addr:bind_to;
If bind raises (say, EADDRINUSE because we’re out of ephemeral ports), the exception
propagates but file_descr is never closed. Each failed bind therefore leaves one
unbound UDP socket open.
We reproduced the leak without touching the network by using an LD_PRELOAD shim to fail
UDP binds on the wildcard address:
int bind(int fd, const struct sockaddr *addr, socklen_t len) {
  // ... if this is a UDP bind to 0.0.0.0:0 ...
  errno = EADDRINUSE;
  return -1;
}
Under the shim, a consumer-group monitor opens a new file descriptor after every failure:
LD_PRELOAD: failing UDP bind(0.0.0.0:0) fd=20
LD_PRELOAD: failing UDP bind(0.0.0.0:0) fd=21
LD_PRELOAD: failing UDP bind(0.0.0.0:0) fd=22
...
LD_PRELOAD: failing UDP bind(0.0.0.0:0) fd=100
Rebuild with the fix and the same injected failure recycles the same fd forever (fd 20, fd 20, fd 20, …): no leak.
And in reproduction, bpftrace identified dns-lib as the caller creating the
sockets. This is the same dns-lib path that called res_init in the glibc segfault.
So who’s exhausting the ephemeral ports?
The leak needs bind to fail, and bind fails when ephemeral ports are exhausted. The
sar data from the box tells that half of the story:
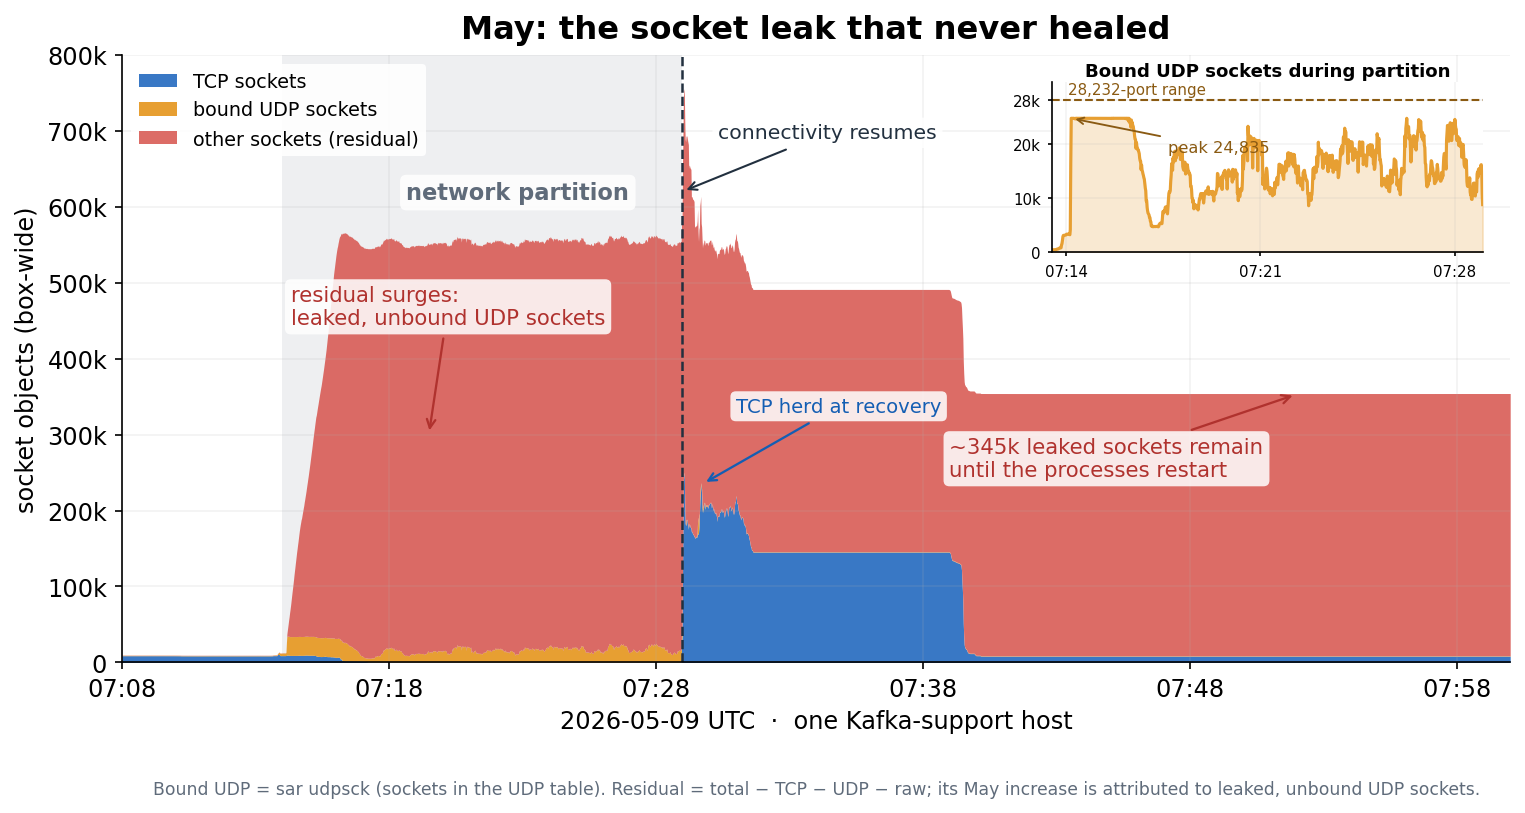
The graph shows three phases:
- During the partition, bound UDP sockets slam into a hard ceiling: 24,835 of them,
and then they sit at exactly that number, second by second, against an ephemeral range
of 28,232 ports. Meanwhile the total socket count climbs past 580,000. The residual
between the total and the TCP/bound-UDP series includes other socket families, but the
increase is overwhelmingly the created-but-never-bound UDP sockets identified
above. (
sar’sudpsckonly counts bound sockets actually in the UDP table; the orphaned ones still show up intotsck.) - At recovery, TCP sockets spike. We’ll come back to that in Act III.
- Afterward, everything drains back to baseline except the total socket count, which settles onto a plateau at 354,195 and stays there, about 345,000 above the 9,497 it started at. That persistent increase is the leak identified above. Connectivity resumed and the box never healed: the plateau was still sitting there two days later, until the processes were restarted.
Some back-of-the-envelope math makes the exhaustion plausible: ~28k ephemeral ports across
~79 Kafka support processes is only ~358 ports per process. Our dns-lib queries 3
nameservers in parallel. It doesn’t take many concurrent dns-lib queries per process to
drain the shared pool. While it remains drained, each failed UDP bind leaks another
socket.
This leak provides the FD pressure needed to make res_init fail and trigger the glibc
bug. syslog caught it directly, in a DNS query whose bind on 0.0.0.0:0 returned
EADDRINUSE:
"DNS query failed" (addr 127.0.0.1:53)
(Unix.Unix_error "Address already in use" bind "((fd 20) (addr (ADDR_INET 0.0.0.0 0)))")
This explained the leak and the crash, but not the DNS demand that exhausted the ephemeral ports. We did not answer that until July.
Act III: The thundering herd
We rolled out the glibc and socket library fixes. During another scheduled maintenance in July, two relays crashed outright after reaching their FD limit:
(monitor.ml.Error
 (Unix.Unix_error "Too many open files" getpwuid_r 16429)
 ...)
Looking at sar, this time the sockets were TCP connections, and the surge happened at
recovery, not during the partition:
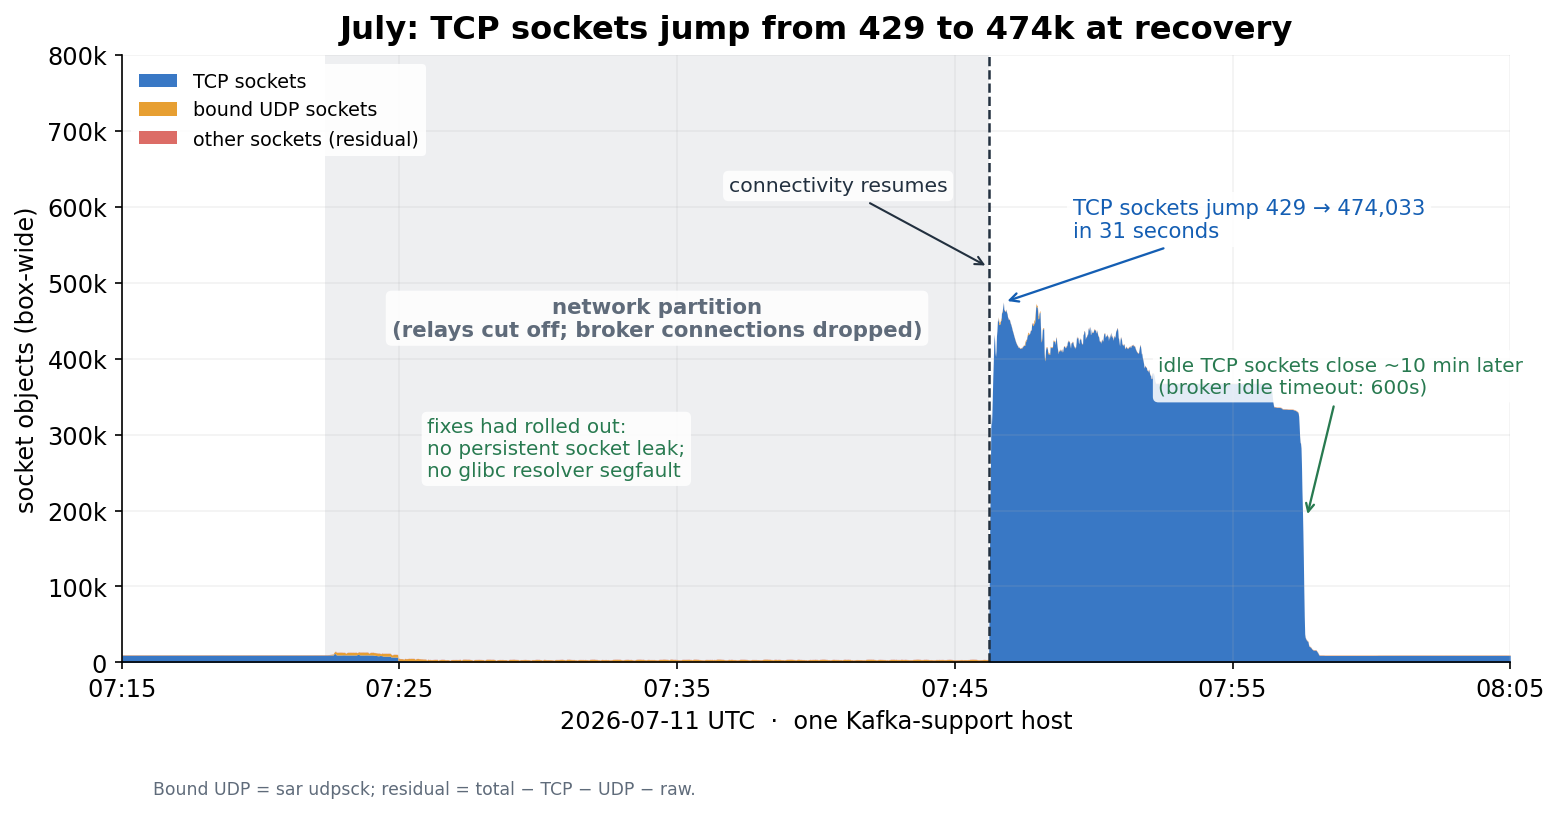
During the 24-minute partition, TCP connections collapse: the relays can’t reach their brokers, so the connections drop and the count flatlines near zero. (Note the orange line: bound UDP sockets tick up during the partition, consistent with DNS retry traffic, and it’s a clue we’ll come back to.) The lack of a persistent residual is consistent with the socket-library fix. Then the instant the switch comes back at 07:46:14, TCP connections rise from 429 to a peak of 474,033 in half a minute, before slowly draining. Two relays happened to cross their per-process 32,768-FD limit and died.
This looked like a textbook thundering herd: everyone who was blocked during the outage unblocks at once. The remaining question was why recovery produced far more connections than the relays need in steady state. Three behaviors interacted to produce the excess.
Connections that outlive their timeouts
Kafka brokers have a “purgatory”: some requests get no response until a condition is met or a timeout elapses, and since responses come back in order, such a request effectively blocks the connection. To avoid head-of-line blocking, our client maintains a connection pool, reusing an idle one or opening a new one per blocking request:
let obtain_connection t ~context =
  remove_closed_idle_connections t;
  match Doubly_linked.remove_first t.idle_connections with
  | Some connection -> Send_result.Deferred.return connection
  | None -> (* open a new connection *) ...
That module’s own documentation already states that it relies on callers to be well-behaved and not have too many blocking requests outstanding at once. The callers are well-behaved under normal conditions, but an outage changes how long requests remain outstanding.
Requests go through a retry loop with a timeout:
let create ~time_source ~timeout ~context deferred =
  match%map Timeout.with_timeout ~time_source timeout deferred with
  | `Result result -> Result result
  | `Timeout -> Timeout { timeout; context }
When the retry loop reports a timeout, it does not cancel the underlying deferred. The
connection attempt keeps running in the background. So during the partition, the retry
loop thinks each attempt has timed out and moves on, but every one of those “abandoned”
attempts is still alive, still waiting to open a connection.
Timeouts that don’t cover DNS
Those attempts don’t fail on their own, because opening a connection starts with a DNS
lookup, and in Async_unix.Tcp.connect_sock the timeout doesn’t cover it:
where_to_connect.remote_address ()   (* DNS resolution: not covered by timeout *)
>>= fun address ->
let timeout = Time_source.Event.after time_source ... in
The timeout and interrupt only start counting after remote_address ()
resolves. Nothing aborts the DNS lookup itself. During the partition, the Async DNS
throttle queues these lookups.
We looked into the code history in our internal monorepo and the code wasn’t always this
way. In January 2012, an Async refactoring that splits out connect_sock_gen to support
Unix sockets moved the resolution outside the timeout, seemingly by accident; there’s no
discussion of the semantic change in the adjacent commits. It sat unnoticed for fourteen
years: DNS normally resolves fast enough that whether the timeout covers it makes no
observable difference.
Putting the three together explains the thundering herd. During the partition, each relay’s ~1,500 consumer groups keep retrying; each retry launches a connection attempt; each attempt “times out” in the retry loop but keeps its DNS lookup queued in the throttle. The queue grows for the entire outage. When the switch comes back, the throttle drains fast, every queued lookup resolves nearly at once, and every one of those long-abandoned attempts finally opens its connection and hands it back to the pool.
The numbers line up
This is the part that turned a plausible story into a high-confidence one. From the logs:
- The partition lasted from 07:22:19 to 07:46:14, i.e. 1,435 seconds.
- Each failed request cycle took ~80s, so ~18 cycles fit in the outage.
- The relay hosts ~1,500 consumer groups.
- 18 × 1,500 = 27,000 connection attempts.
Our service logs showed 27,898 connection attempts on one surviving relay and 27,786 on
another. Shortly after recovery, our host monitoring reported 27,927 and 28,099 open file
descriptors on those same two processes, respectively. The connections then drained about
ten minutes after recovery, matching Kafka’s connections.max.idle.ms default of
600s. That is the cliff on the right of the graph.
The same mechanism appears in the May graph as the brief bump annotated “TCP herd at recovery” (TCP there peaked at 249,288, and stayed above 200,000 for about 25 seconds). In May it was drowned out by the socket-leak story and didn’t push any process over its FD limit, so nobody looked twice.
A likely explanation for Act II’s loose end
This retry storm also suggests an answer to the question left open in Act II: where did the UDP surge come from?
It’s tempting to say the UDP spike was just DNS for these TCP connections, but that cannot
explain its scale. Those broker-hostname lookups go through the Async_unix / glibc path,
which is throttled; they queue rather than growing without bound. The remaining candidate
is the unthrottled path.
Our best explanation is that the same retry storm fed two different DNS paths:
- Broker connections resolve via the glibc path, queue behind the Async DNS throttle during the partition, and become the recovery-time TCP thundering herd (Act III).
- Locating the discovery service is different. Instead of static bootstrap lists, our
clients find brokers by asking an in-house “metadata server”, a small OCaml service that
knows which brokers are responsible for which topics. Looking up that service’s own
address goes through our service-discovery layer, which uses
dns-liband bypasses the throttle, so during the partition it runs wide open. We’re less certain about this half (we never fully pinned down the May demand after the fact), but it very likely was the dominant source of the partition-time UDP pressure that exhausted ephemeral ports and triggered the socket leak (Act II) and, in turn, the glibc segfault (Act I).
A code comment in the bootstrapper for this discovery path (a “CR-someday” in our convention, a known improvement filed for later) had already described this risk:
(* CR-someday: Cache pending requests so that concurrent requests don't get
   sent to the metadata server multiple times looking for the same information,
   crowding the server. ... *)
This gives us a plausible common upstream cause for the UDP branch, though unlike the TCP branch we could not verify it directly after the fact.
Why did this start in April?
Strictly speaking, it didn’t. After an August 2025 maintenance, one relay was left holding 145k unbound UDP sockets, the same socket leak we diagnosed the following May. We restarted it and moved on. Relays showing unexplained memory growth during network partitions had also been a source of toil for years. We took a closer look only when the failures became segfaults in April.
What changed was our file-descriptor limit. Kafka support processes had been running with
a soft limit of 262,144, set through overrides in /etc/security/limits.d. When we
migrated one of our internal job runners to use systemd user services, its new startup
path stopped applying those overrides. Jobs launched by that runner instead inherited the
default soft limit for systemd user services on our hosts: 32,768. Ours dropped by a
factor of eight and nobody noticed. We had treated 32,768 as normal because it’s already a
big number.
The migration began rolling out to 10% of production boxes in late March, including the Kafka support box that segfaulted, and expanded to all production boxes in May. The regression affected other systems using the same job runner and limit overrides too. This investigation caught a pending limit drop for some of them before the change took effect on most of their infrequently rebooted hosts.
How it all fits together
Every incident began with the same trigger: a network partition that made DNS hang while Kafka’s retry loops kept firing.
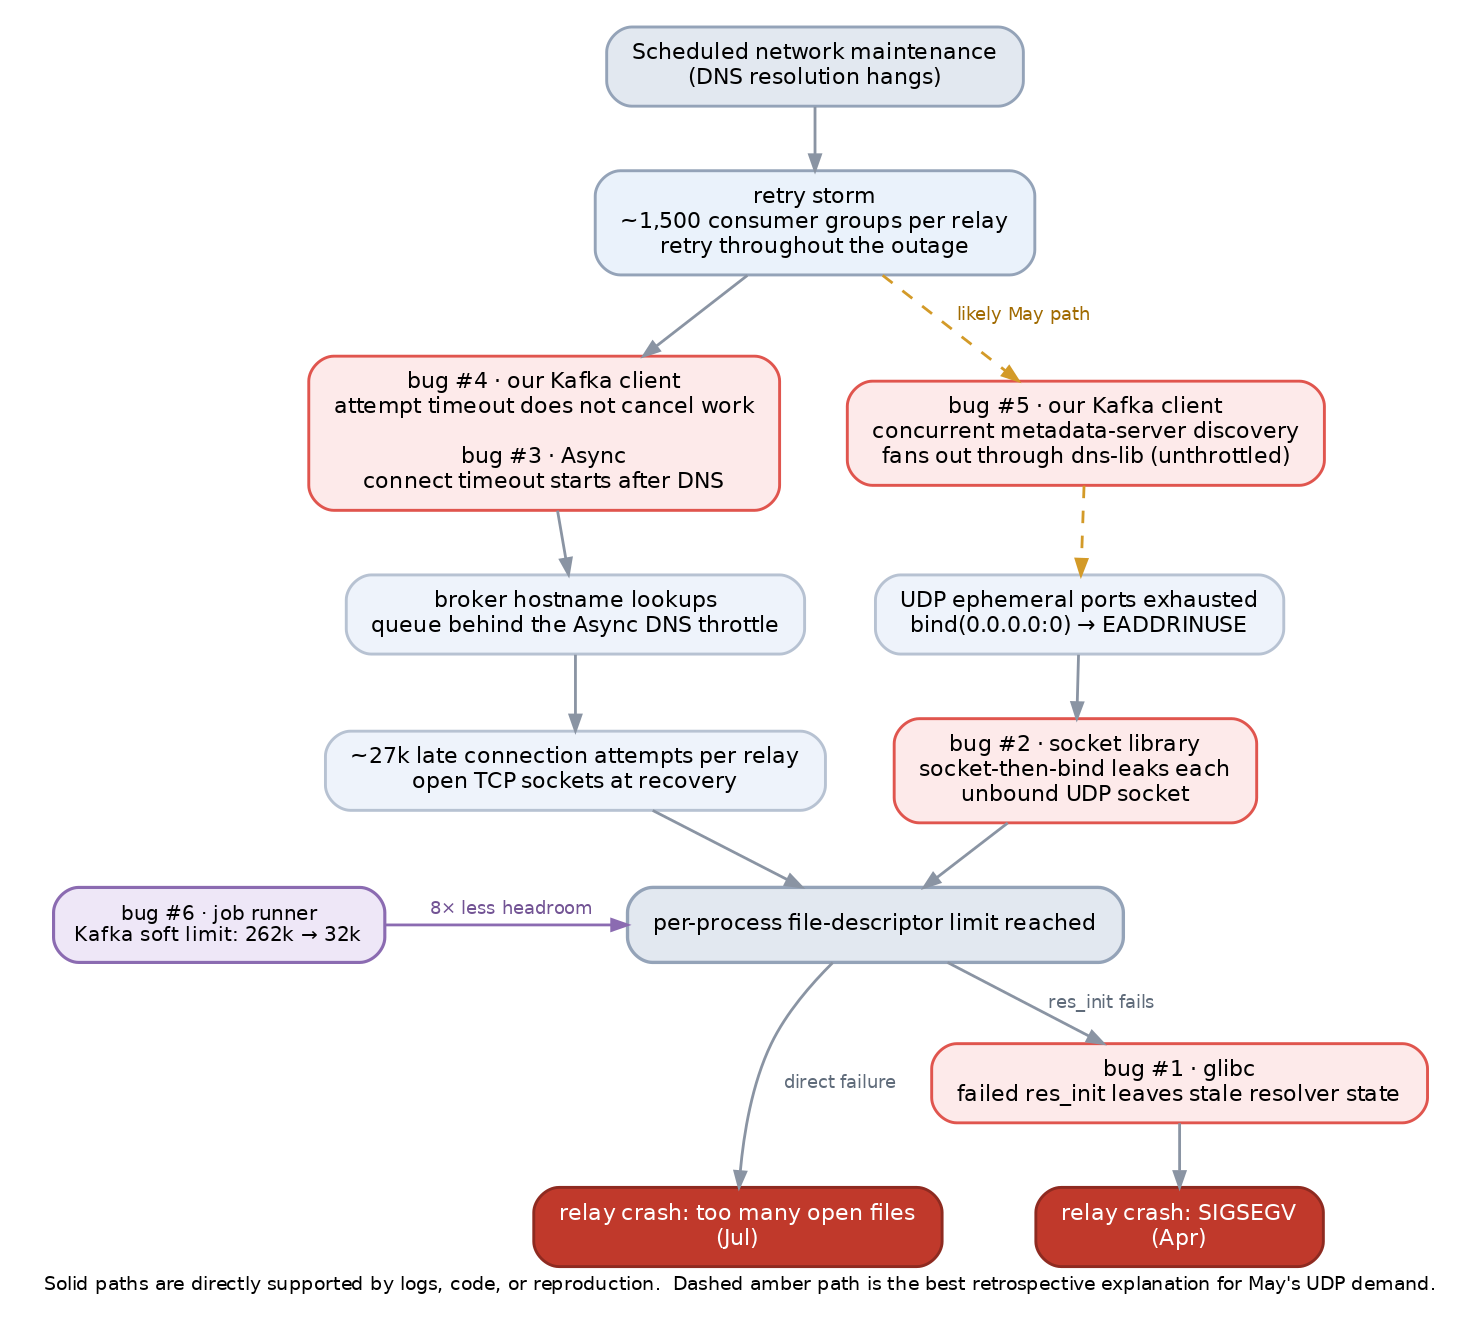
Bugs #2–#5 create or retain sockets; bug #6 lowers the threshold. Both branches converge on FD exhaustion, which either fails directly or triggers bug #1.
The reason this took three investigations to understand is that we kept entering the graph at a leaf. Act I found the segfault and could only say “something caused FD pressure.” Act II found the leak and could only say “something caused a demand surge.” Act III finally exposed the retry storm at the top: it established the TCP branch and supplied our strongest explanation for the otherwise unexplained UDP demand.
The fixes
No single change is “the” fix; each closes the chain at a different layer.
In glibc, res_init now handles a failed re-initialization gracefully instead of
leaving a half-initialized resolver behind
(upstream,
shipped in 2.44). In our socket library, a failed bind now closes the socket it
created. In Async, Tcp.connect_sock’s timeout now covers DNS resolution (the fix
will be included in our next public release on GitHub), so a connection attempt stuck in
name resolution returns at the deadline — and a late DNS result can no longer open a TCP
connection nobody is waiting for, even though Async can’t cancel the glibc lookup
itself. In our Kafka client, the retry loop now cancels an expired blocking attempt
and cleans up its connection work, and the bootstrap path caches in-flight endpoint
lookups so concurrent requests share one lookup instead of each doing their own. We’ve
also audited other users affected by our job-runner migration and patched them to
restore their limits.
Lessons
A few things I’ll take away from this one:
- A timeout does not imply cancellation. Our Kafka client stopped waiting for each
attempt but left it running, while
Tcp.connect_sockdid not start its timeout until after DNS resolution. When adding a timeout, check whether it covers the operation that can hang and whether late completion can still consume resources or cause side effects. - Make multi-step setup failure-atomic, and test the failure paths directly.
res_inittore down valid resolver state before rebuilding it; our socket library created a socket before binding it. Both failed partway and left resources or state behind. We did not need to recreate a real network partition to test these paths:setrlimitforcedres_initto fail, anLD_PRELOADshim forcedbindto returnEADDRINUSE, and a single-threaded Async pool made the cross-library sequence deterministic. - Make the hypothesis predict a number. The TCP-herd theory predicted about 18 retry cycles times 1,500 consumer groups, or 27,000 connection attempts. That matched the log count, the FD count, and the ten-minute drain implied by Kafka’s idle timeout. The same discipline ruled out our first explanation for the UDP surge.
- Model resources at the scope where they are shared. FD limits were per-process,
while the UDP ephemeral-port pool was shared across all processes on the host. Each
process looked individually reasonable, but their aggregate demand exhausted the
host-wide resource.
sar’s per-second socket history was what let us reconstruct this weeks later. - Old and widely-deployed isn’t always the same as correct. The glibc bug is from 2015 and runs on widely deployed glibc releases; the Async regression is from 2012, in one of the most-called functions at Jane Street. Both survived because calm conditions never exercised them. Don’t let “surely the bug isn’t in glibc” stop you from reading the source one layer below your own code. It’s just code. Sometimes it’s wrong.
Redundancy bought us the time to be curious. Each incident was survivable, so we could restore the affected processes and investigate without guessing under pressure. That slack let us follow one resolver crash through socket allocation, DNS throttling, Kafka retries, and process limits until the whole chain made sense.
Oh, and this was my second glibc bug since joining the firm. Hopefully the last one for a while.