Memory issues can be hard to track down. A function that only allocates a few small objects can cause a space leak if it’s called often enough and those objects are never collected. Even then, many objects are supposed to be long-lived. How can a tool, armed with data on allocations and their lifetimes, help sort out the expected from the suspicious?
The Memtrace library and viewer are Jane Street’s new profiling tools, aiming to answer this question, and we’re excited to be releasing them publically. We’ve been using them internally for a few months now, and we’re finding we can often find a space leak using just some basic data visualization and the human ability to say “Hang on, what’s that?”
Memtrace is built on top of the excellent new support for statistical memory profiling that was added to the OCaml runtime in OCaml 4.11. Special thanks to Jacques-Henri Jourdan at CNRS and our own Stephen Dolan for all their great work on adding that support.
The new profiling support allows a program to get callbacks on garbage collection events for a sample of the program’s allocations. The Memtrace library uses these callbacks to record allocation events in a compact binary format. The Memtrace viewer then analyses the events and presents graphical views, as well as filters for interactively narrowing the view until the source of the memory problem becomes clear.
As discussed on this blog,
OCaml already had support for profiling memory using its Spacetime
framework. Spacetime would gather data on all the allocations
performed by a program. It was very useful for finding memory leaks
but had a high overhead and required using a special configuration of
the OCaml compiler. Its profiles could become very large and require
huge amounts of memory to process.
In comparison, the new profiling support:
- profiles a sample of the allocations, not all of them
- works with the ordinary OCaml compiler
- is supported by all platforms
- can run with low enough overhead to be used in production systems
Generating a trace
There is no special compiler or runtime configuration needed to
collect a trace of your program. You need only link in the memtrace
library and add a line or two of code. The library is available in
OPAM, so you can install it by running
$ opam install memtrace
and link it into your application by adding it to your dune file:
(executable
 (name my_program)
 (libraries base foo bar memtrace))
Now you need only add the code to create a trace. For most applications,
it will suffice to add a call to Memtrace.trace_if_requested
wherever you want to start tracing. Typically this will be right at
the beginning of your startup code:
let _ =
  Memtrace.trace_if_requested (); (* <-- new line *)
  let cmd = process_command_line () in
This will check whether the environment variable MEMTRACE is set; if
so, it stores the trace as $MEMTRACE, using the default sample rate
(or $MEMTRACE_RATE if that’s also set), and continues tracing until
the program finishes. Finer control is available; see the Memtrace
module for details.
If your program daemonizes by forking at startup, make sure that
trace_if_requested is called after forking, so that you trace the
process that does the work rather than the one that exits quickly.
Now simply run the program as usual but with MEMTRACE set:
$ MEMTRACE=trace.ctf ./main.exe
$ ls trace.ctf
trace.ctf
$
Running the viewer
For the examples in this tutorial, we’ll use this trace of a build of the js_of_ocaml compiler which we have subtly altered to induce a space leak.
$ opam install memtrace_viewer
$ memtrace-viewer js_of_ocaml-leaky.ctf
Processing js_of_ocaml-leaky.ctf...
Serving http://your-hostname:8080/
Use -port to listen on a port other than the default 8080.
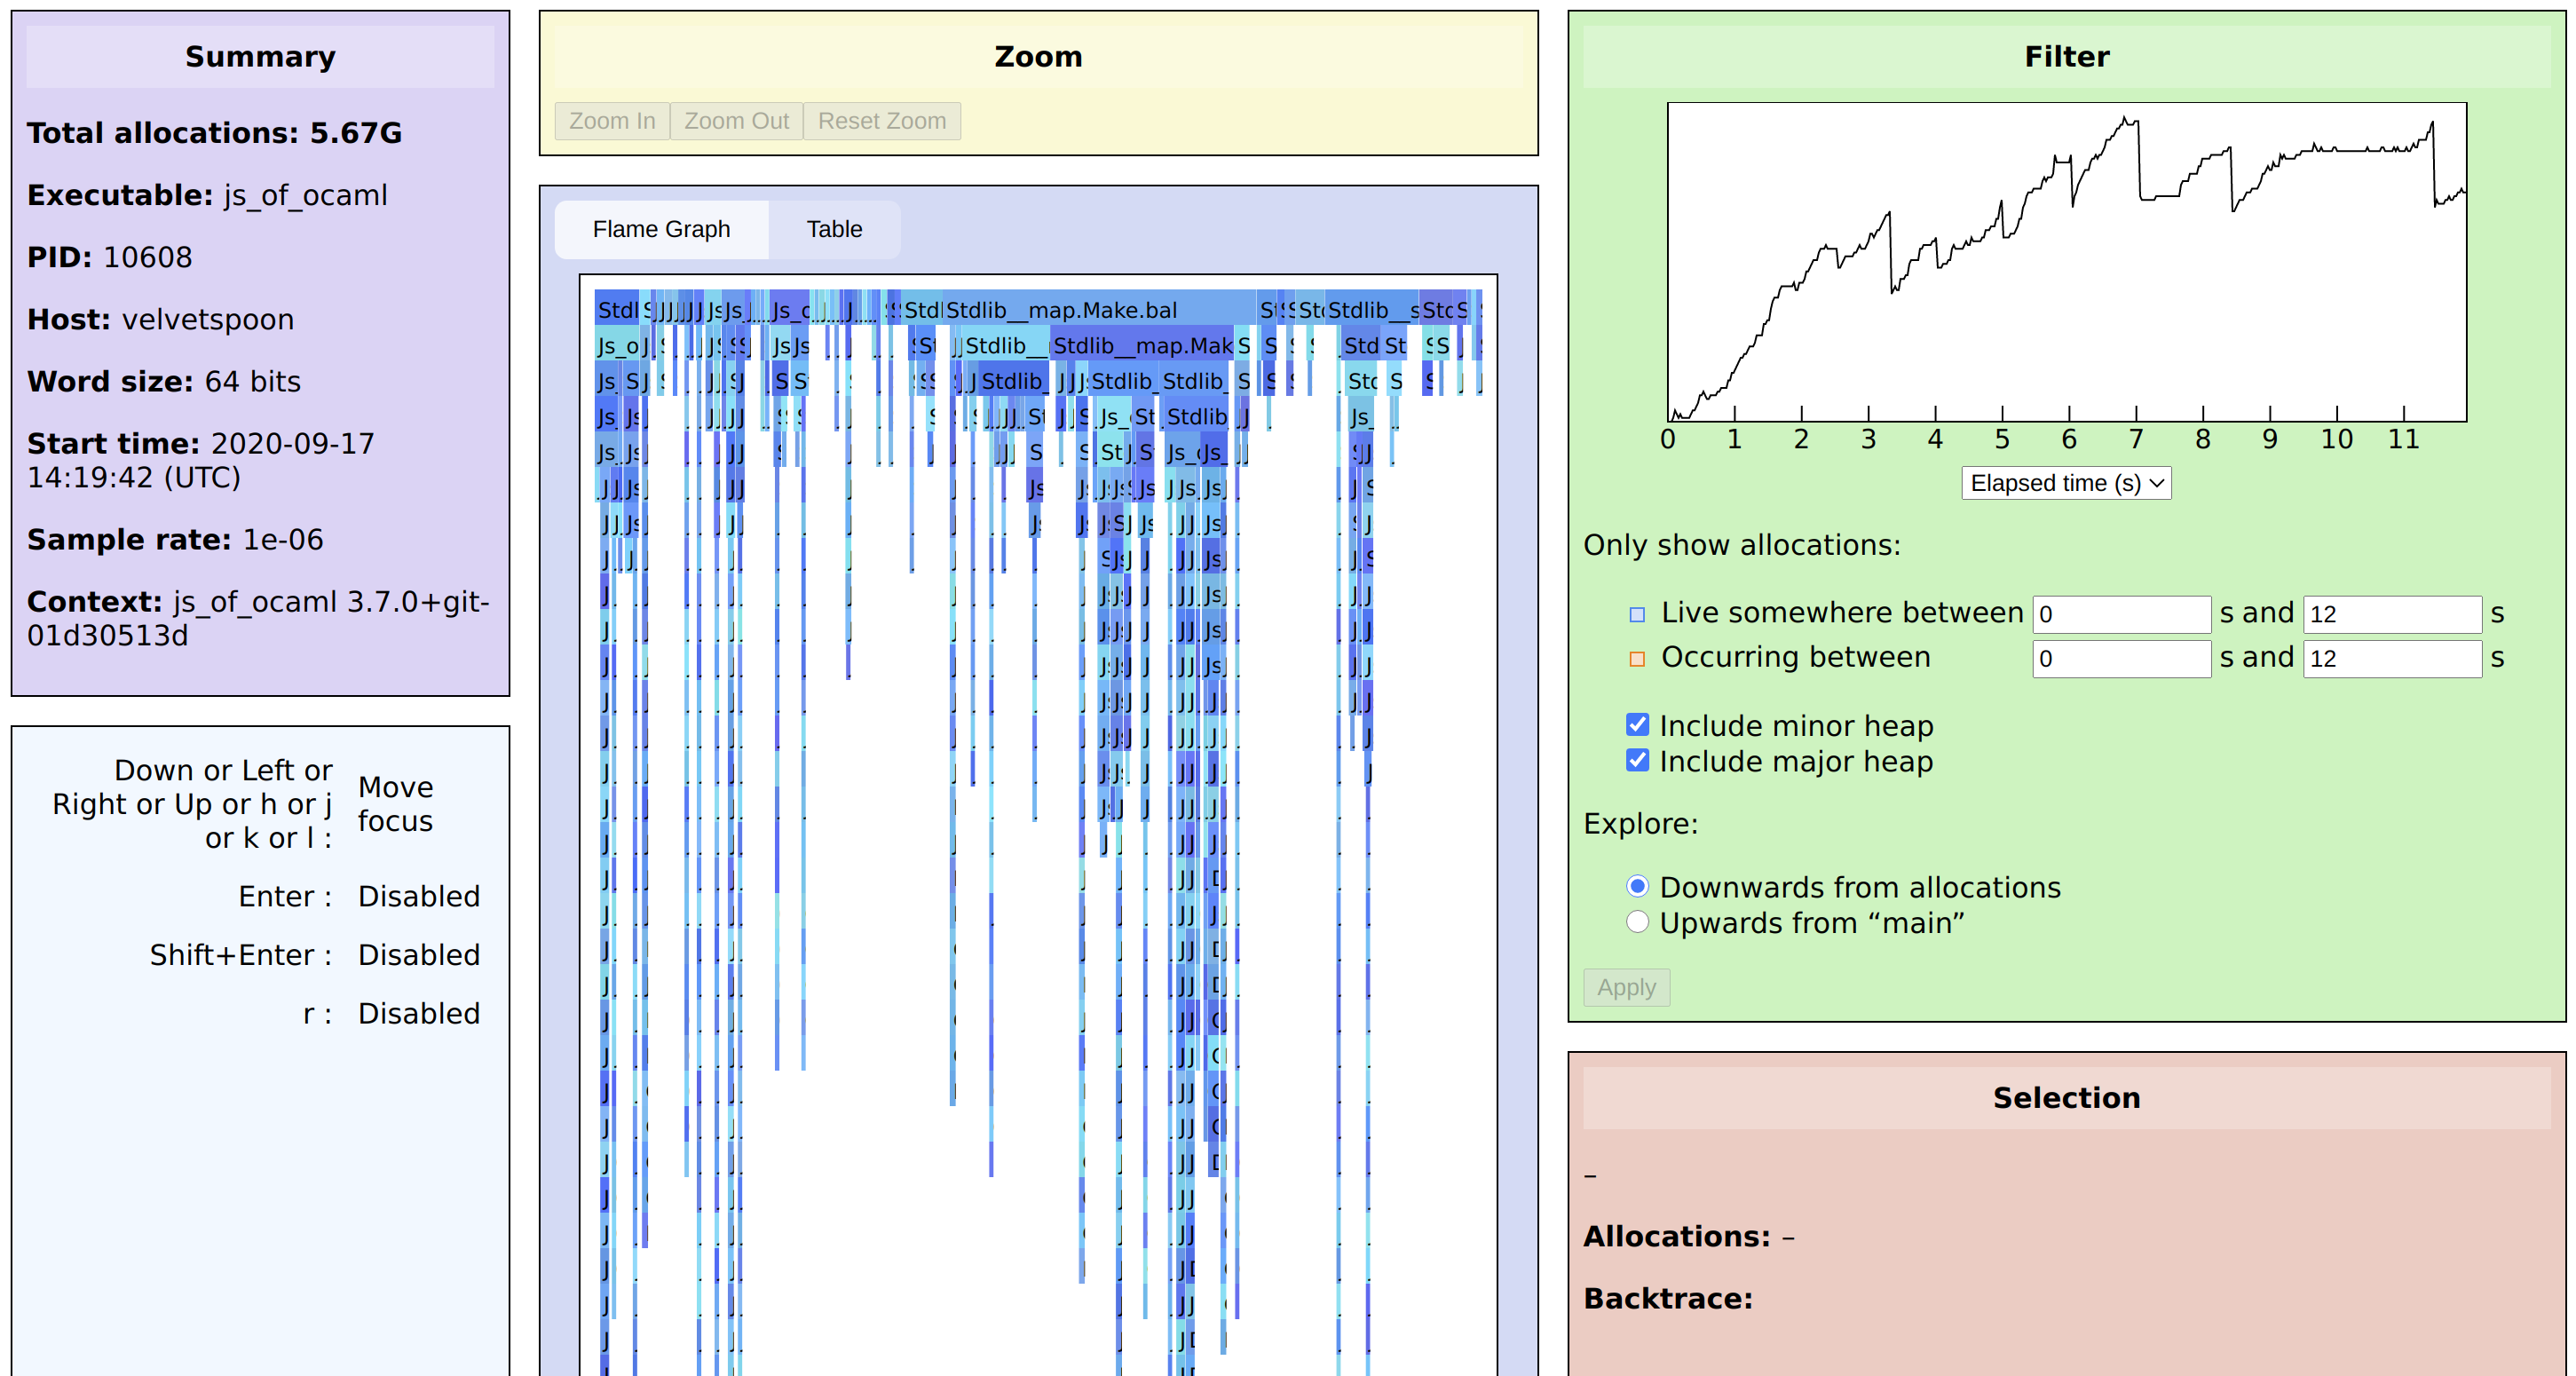
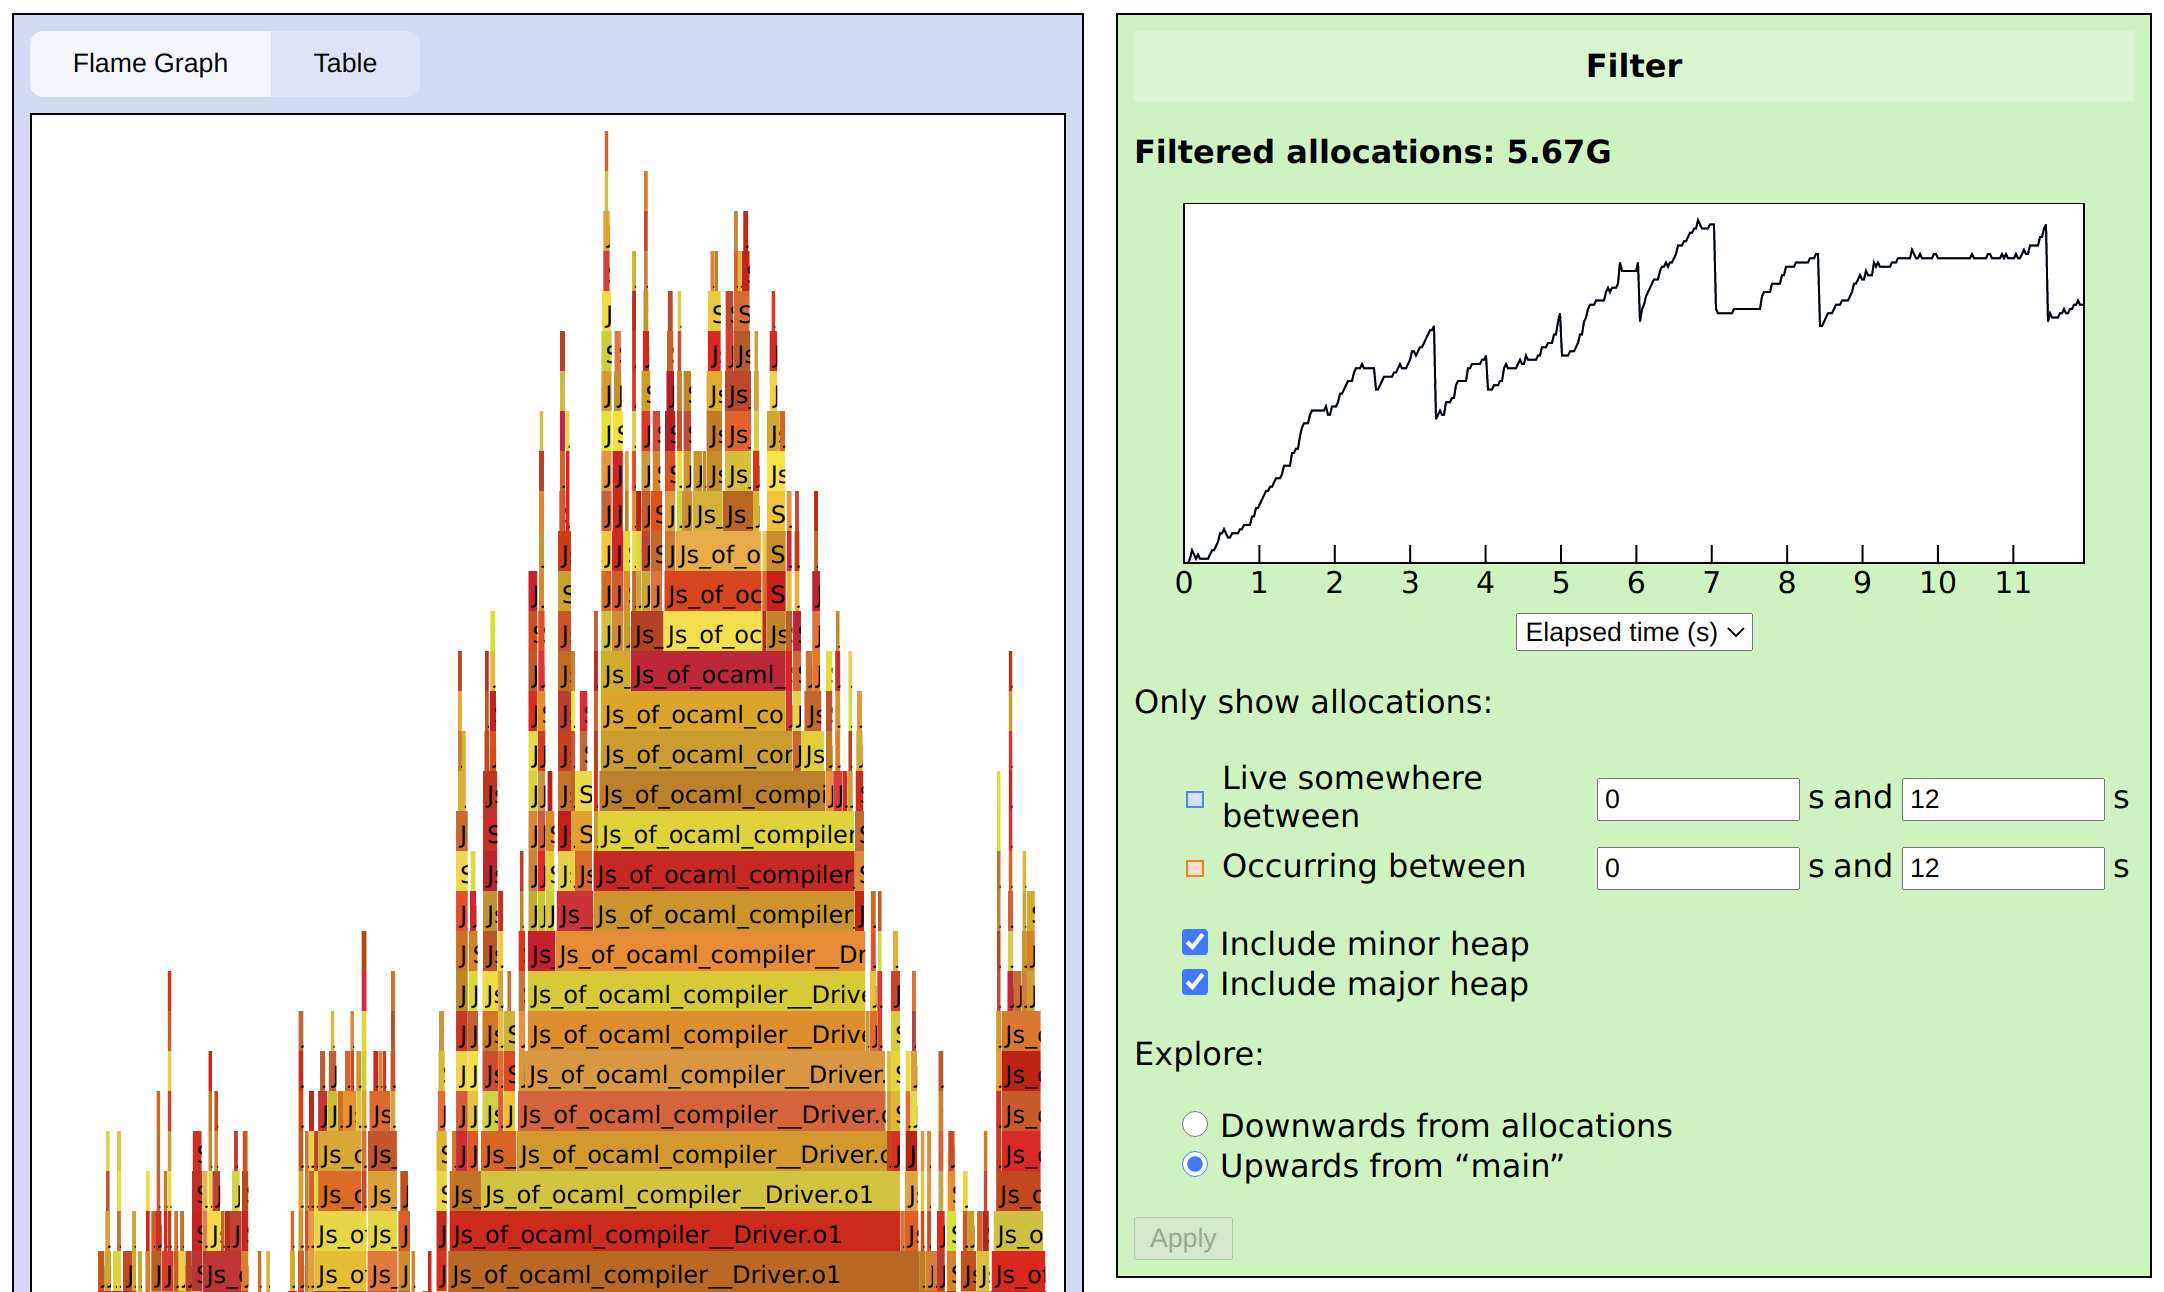
Open the URL to see the main Memtrace viewer interface:
In the middle of the screen is the flame graph. Each function that allocates appears at the top, and underneath each function we see its callers, sized according to which callers caused the most allocations. Note the difference from the traditional flame graph, which subdivides upward into each function’s callees (our variation is often called an icicle graph). Any caller that would account for less than 0.1% of total allocations is dropped from the graph.
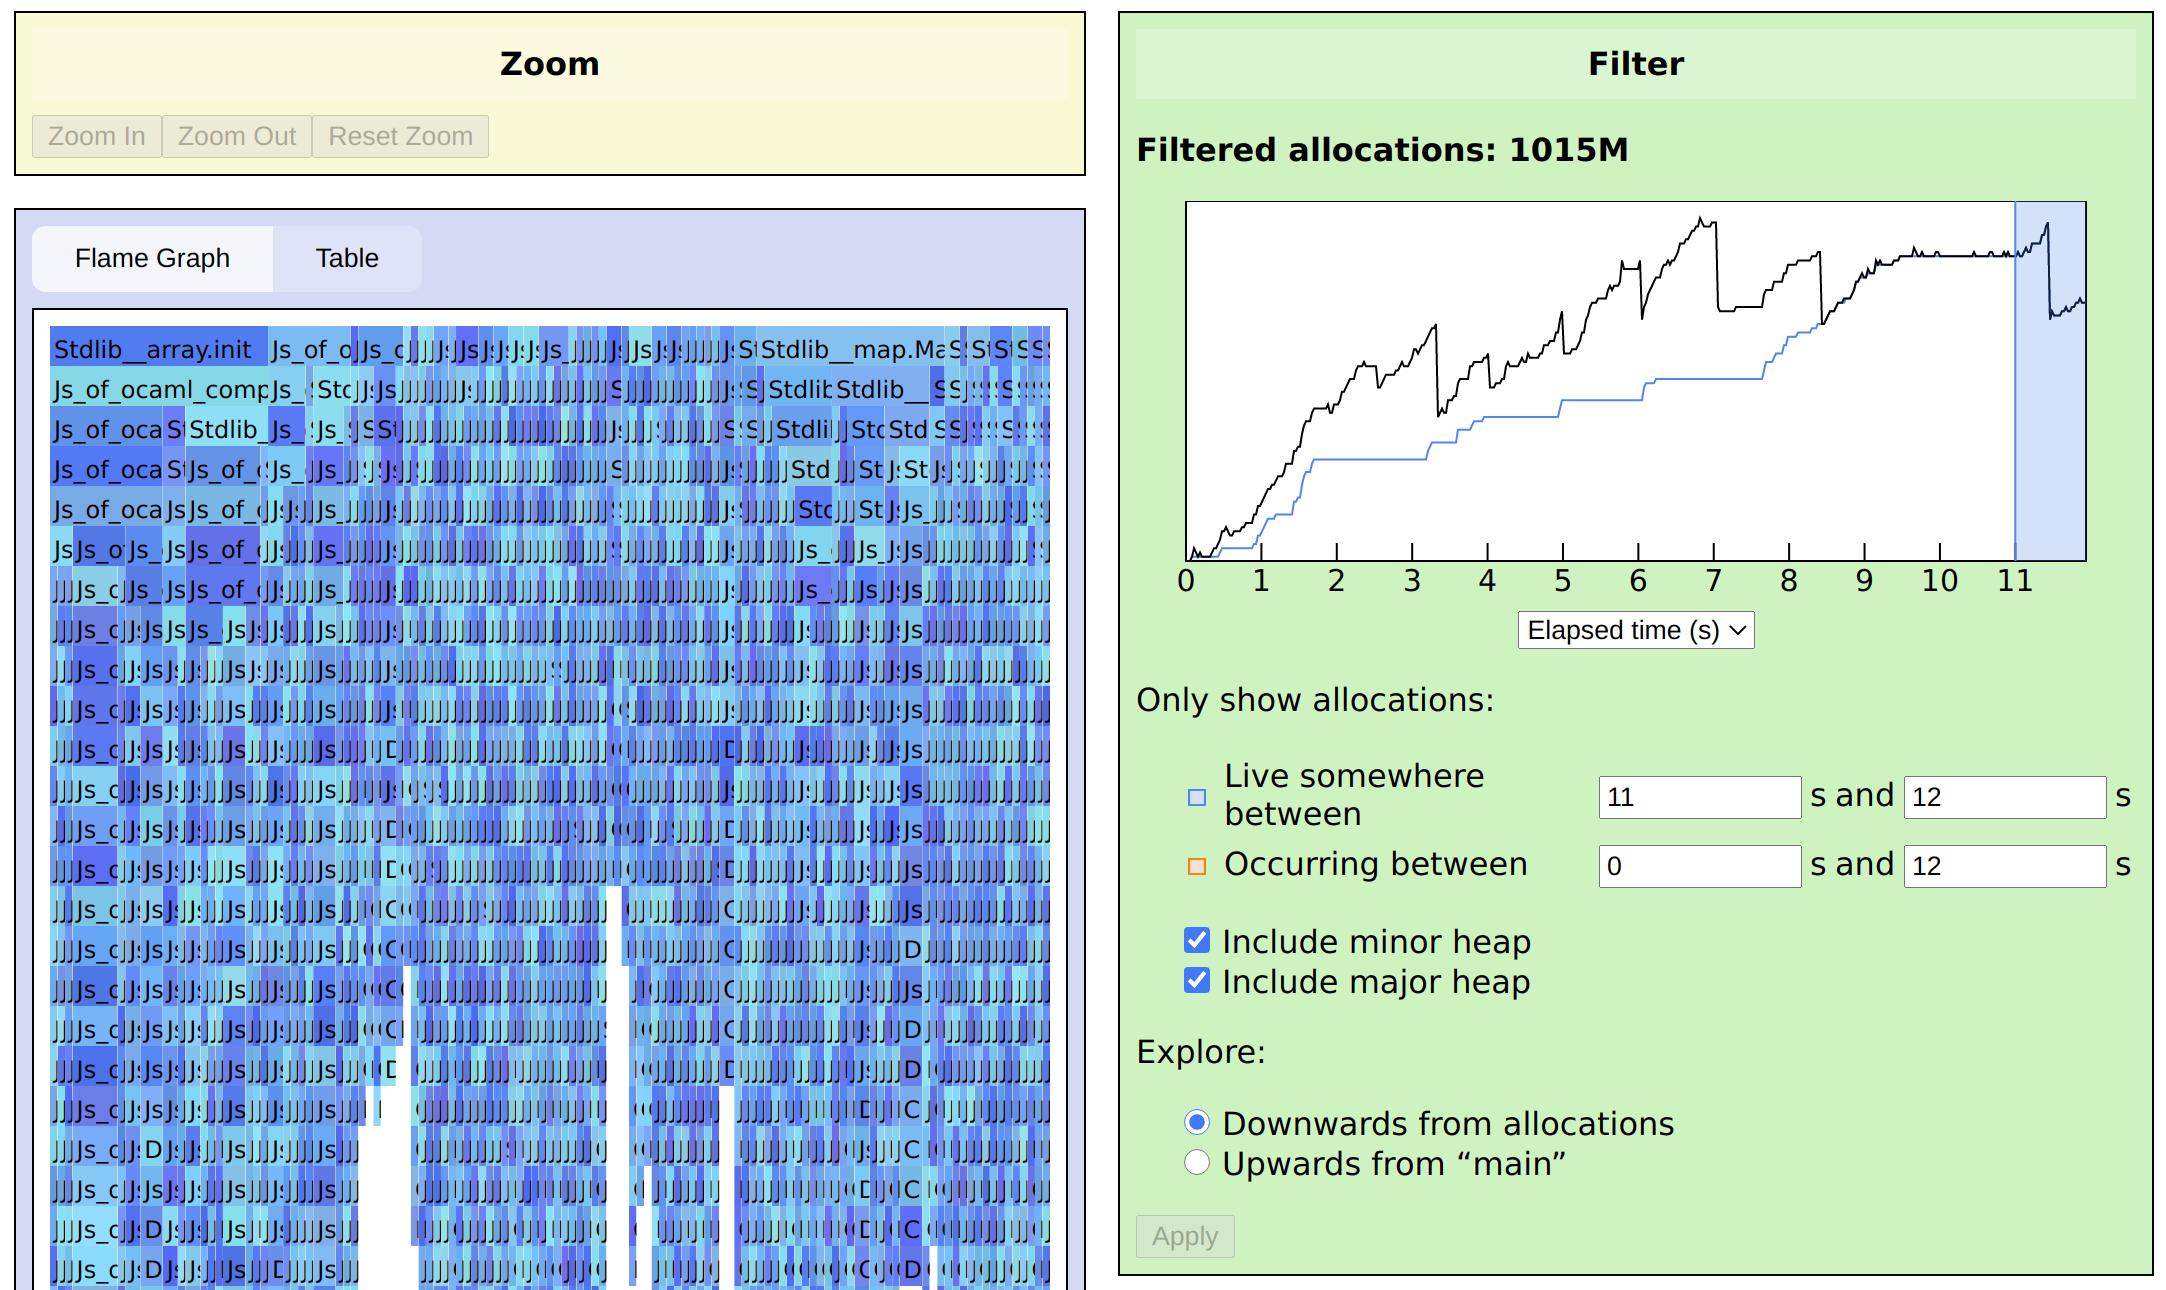
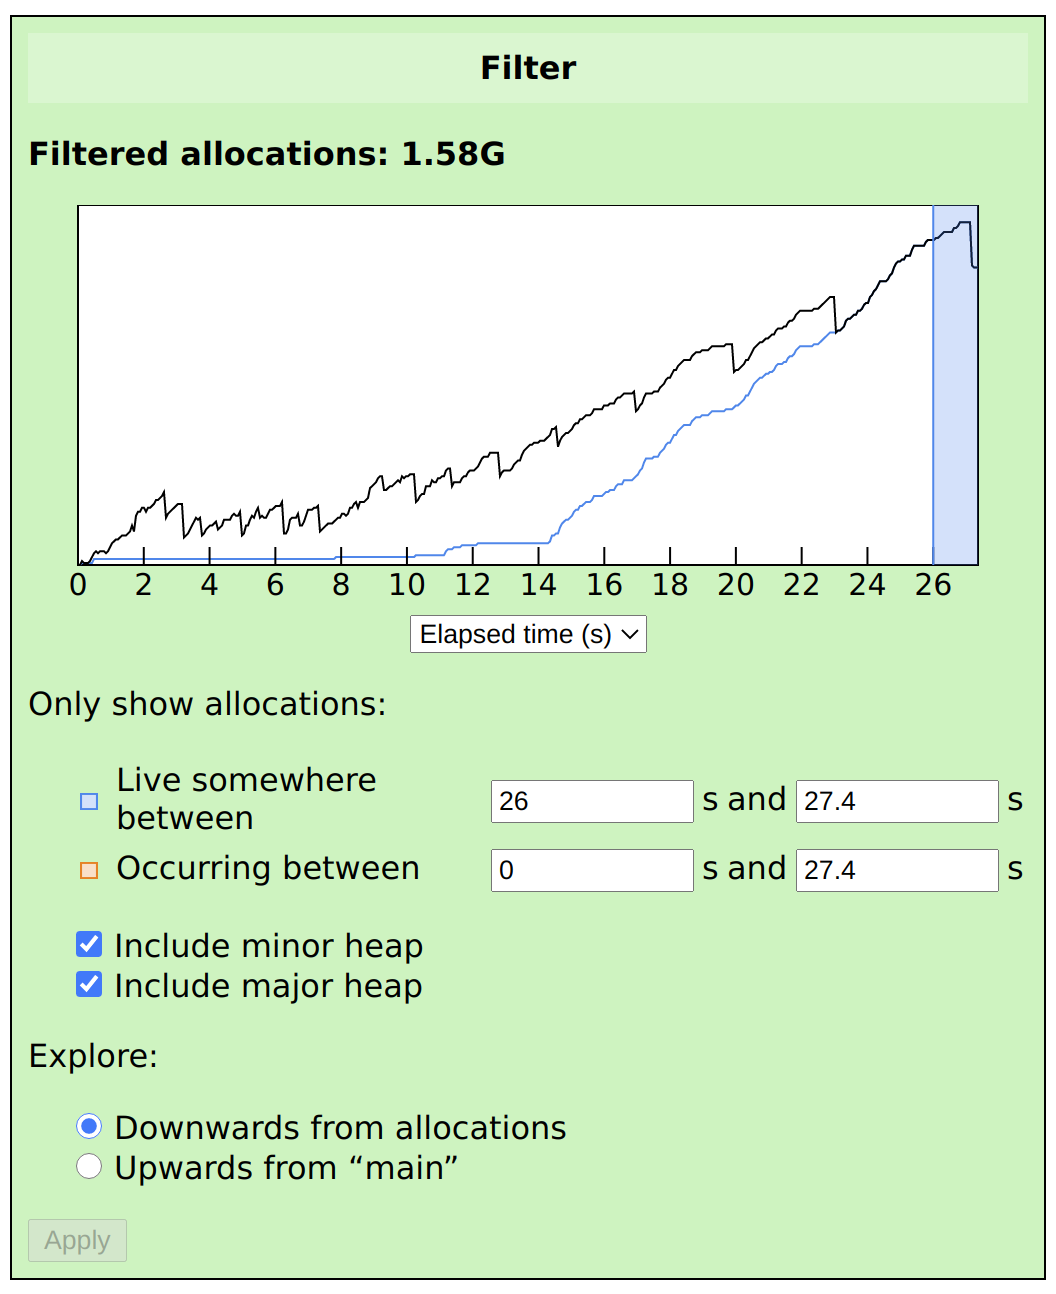
In the top-right corner is a graph of memory usage (specifically, the total live words in the OCaml heap) over time. What the totals can’t tell us, however, is when the allocations contributing to the peak occurred. Perhaps each peak consists entirely of new objects, or perhaps objects from much earlier are accumulating. To tease this out, we can narrow our view to those allocations whose objects remain live at the end of the trace, or wherever the peak happens to be. Here, I set Only show allocations: Live somewhere between to 11 s and 12 s, and click Apply:
We can see that there is a steady stream of allocations the entire time, though the flame graph doesn’t point to any particular culprit. Looking at the line graph again, however, we now see a blue line for the total allocations which pass the filter. Keeping in mind that we’re looking at a compiler, we can distinguish three phases:
- Some initial work that probably includes fixed startup costs, as well as things like identifiers that are allocated during parsing and may still be relevant at the end.
- A gradual accumulation that continues throughout processing.
- A final set of allocations that could easily be the construction of the target code just before output.
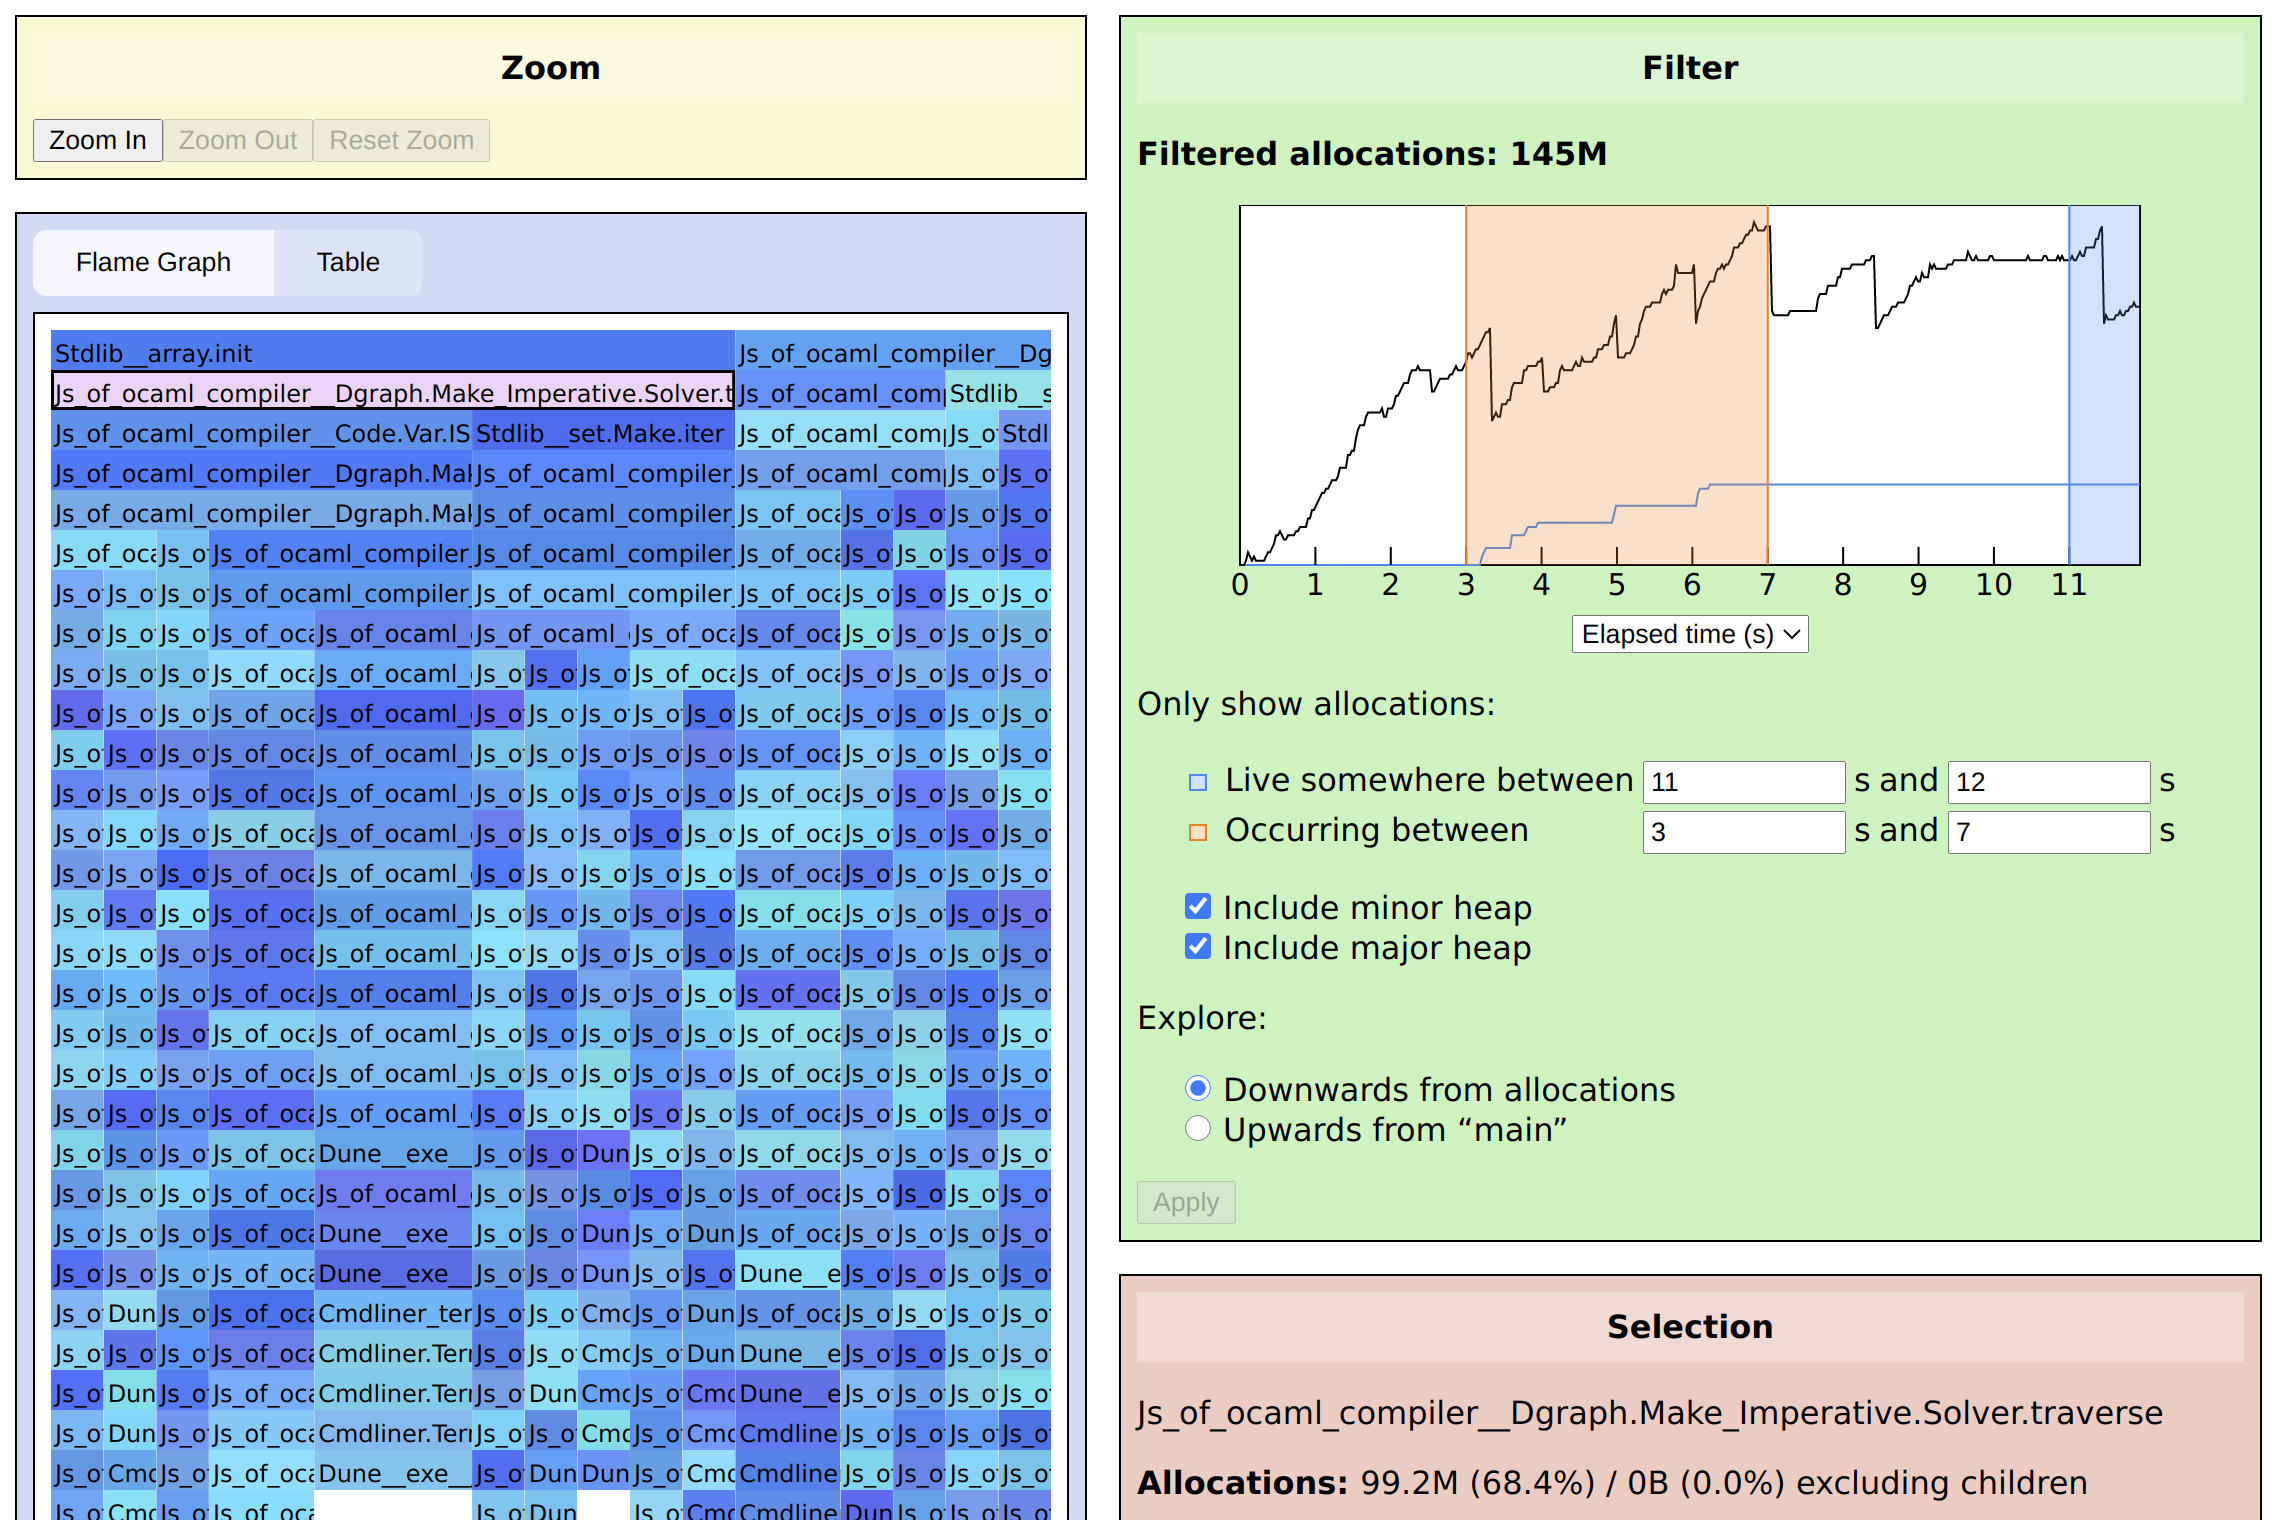
Phases 1 and 3 have innocent explanations, but phase 2 seems suspicious. Therefore let’s narrow our filter again, looking at just the allocations that take place in the middle and remain live at the end. Setting Only show allocations: Occurring between to 3 s and 7 s, we see:
Now it’s quite obvious that the traverse function for directed graphs
is allocating a large amount via a call to Array.init. Importantly,
a traversal function isn’t something we expect to be
allocating much memory, certainly not permanently. And one look at the
code for traverse reveals our mischief:
  let rec traverse g to_visit stack x =
    wasted_memory := Array.init 5 ~f:(fun _ -> 42) :: !wasted_memory;
    if NSet.mem to_visit x
One can only wish memory bugs were always that obvious.
Other viewer features
Table
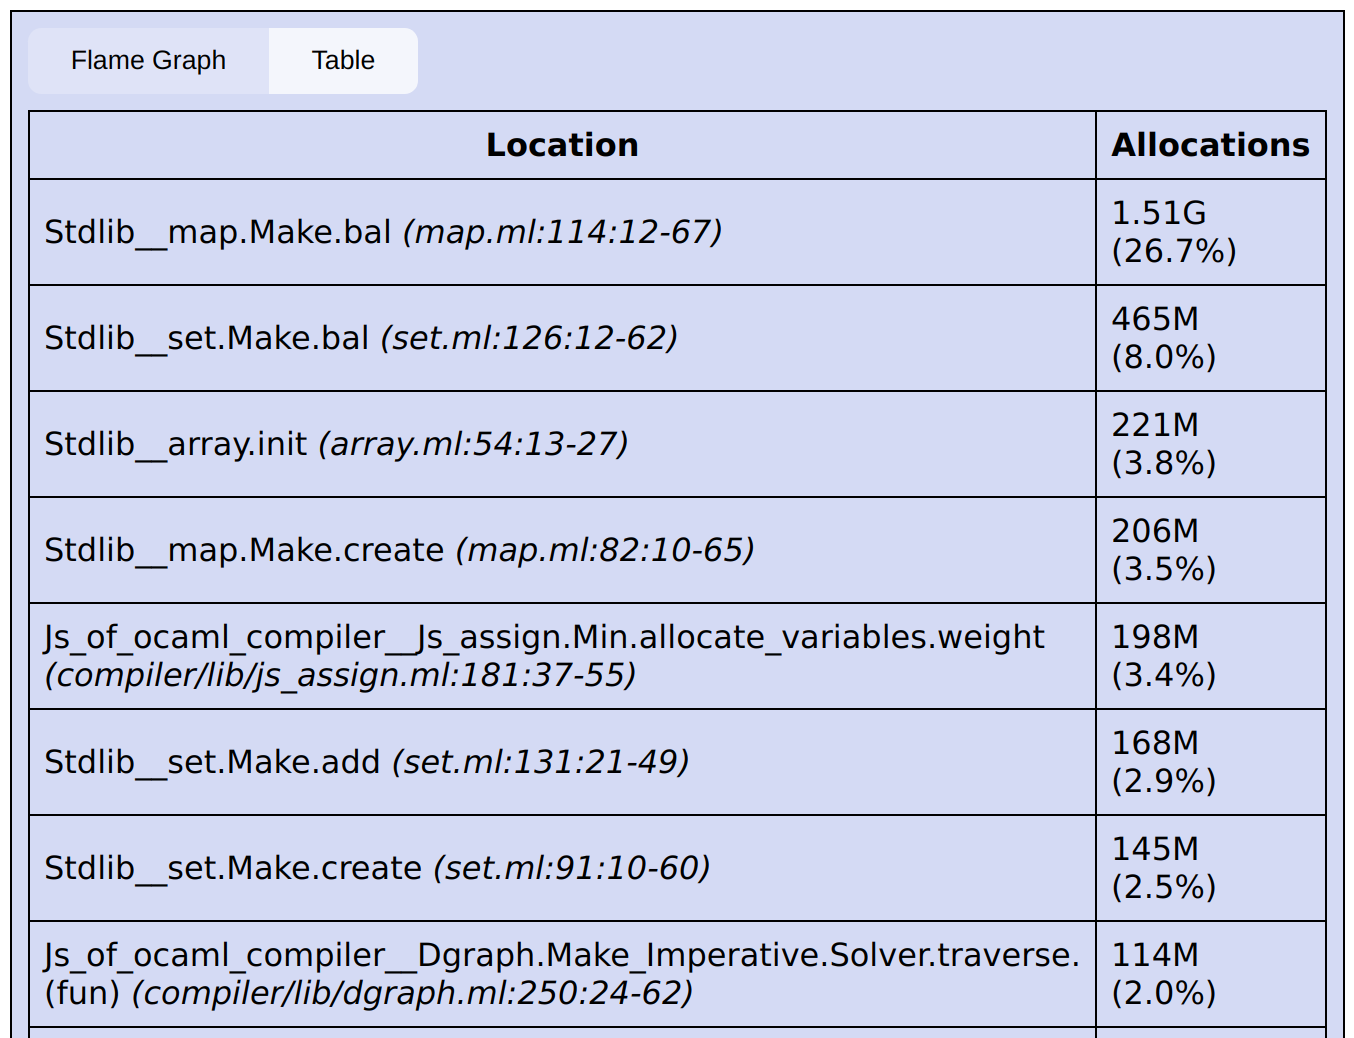
Often the flame graph is too noisy if you just want to see the top allocators. Click the Table tab for a simpler summary view:
Select a row and press the → key to subdivide a function by its callers (much as the flame graph does for all functions).
Direction
By default, the flame graph and the table focus on allocation sites, which is good for finding memory leaks when they are caused by localized problems. For a broader view, you can switch to a traditional flame graph by selecting Explore: Upwards from “main” from the Filter panel and clicking Apply.
Zooming
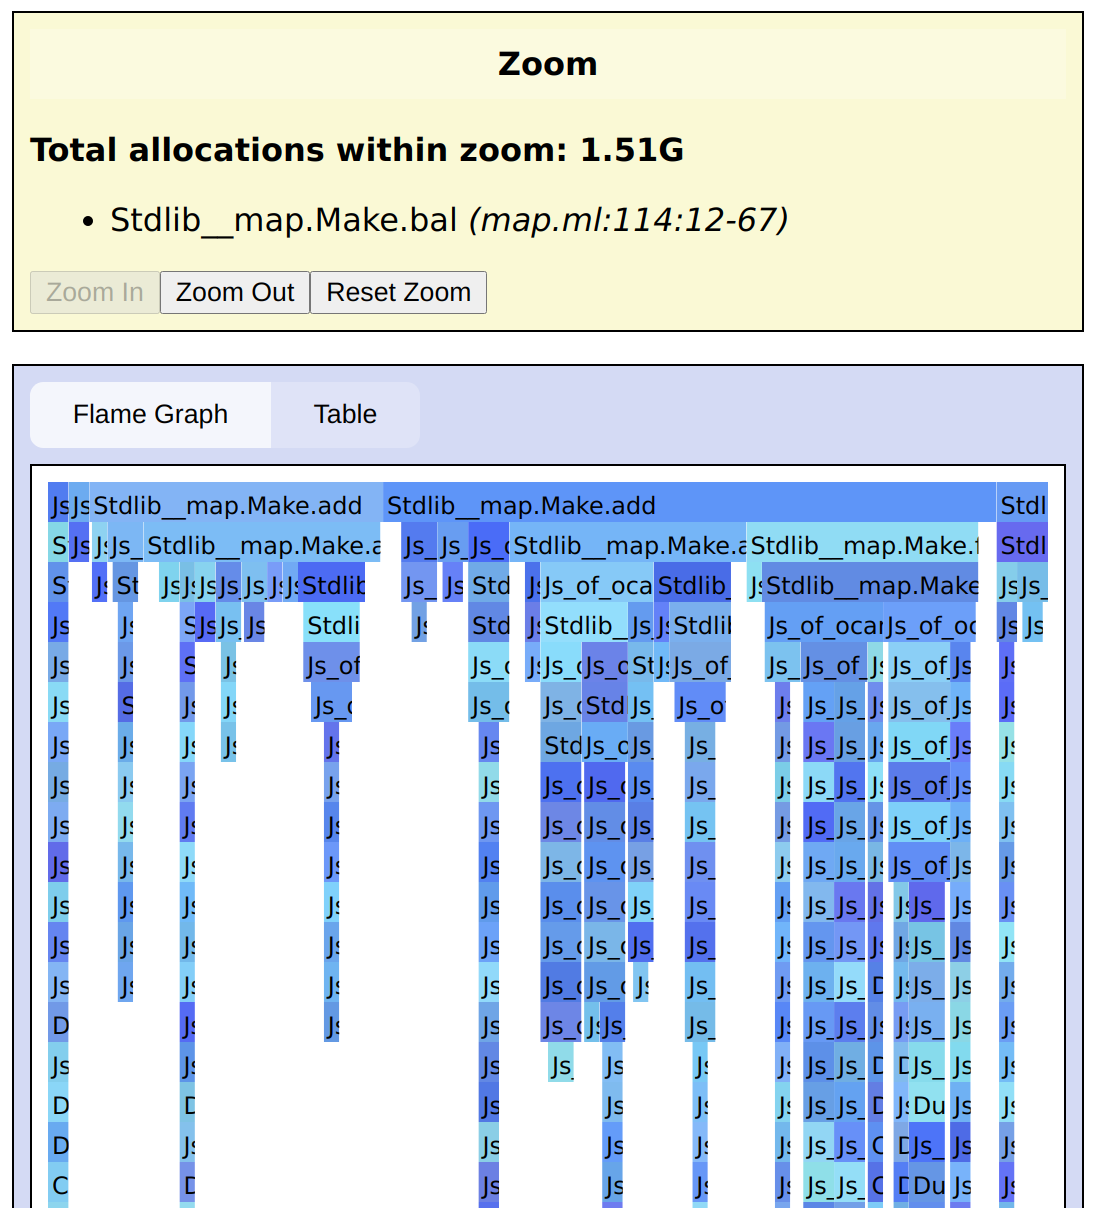
Nodes in the flame graph can easily get too narrow to read, and the table only shows the allocation sites (or top-level code, when exploring upwards) by default. In either view, you can select a function and click Zoom In in the Zoom panel. In the flame graph, this redraws the graph starting from the selected node:
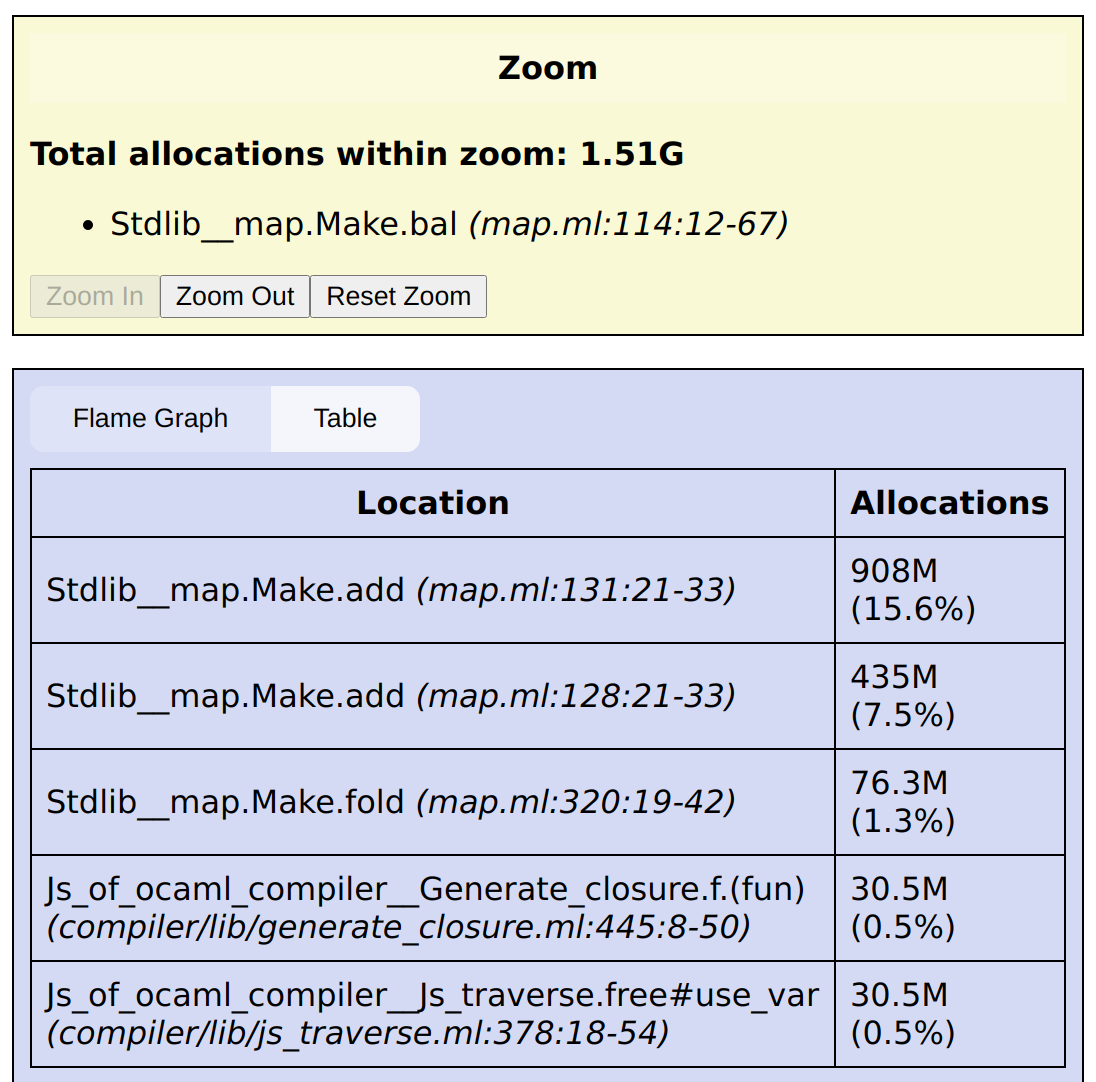
In the table view, this shows the callers or callees of the zoomed function (depending on the direction):
You can click Zoom Out to remove one level of zoom, or Reset Zoom to remove all zoom.
Writing a custom analysis
Of course, memory bugs can be subtler than the one we’ve been looking at, and no viewer can implement every possible analysis you might want to perform. Fortunately, the Memtrace library itself offers a simple yet powerful way to slice the data any way you can think of.
Let’s have a look at another trace, where we’ve induced a different
bug in js_of_ocaml:
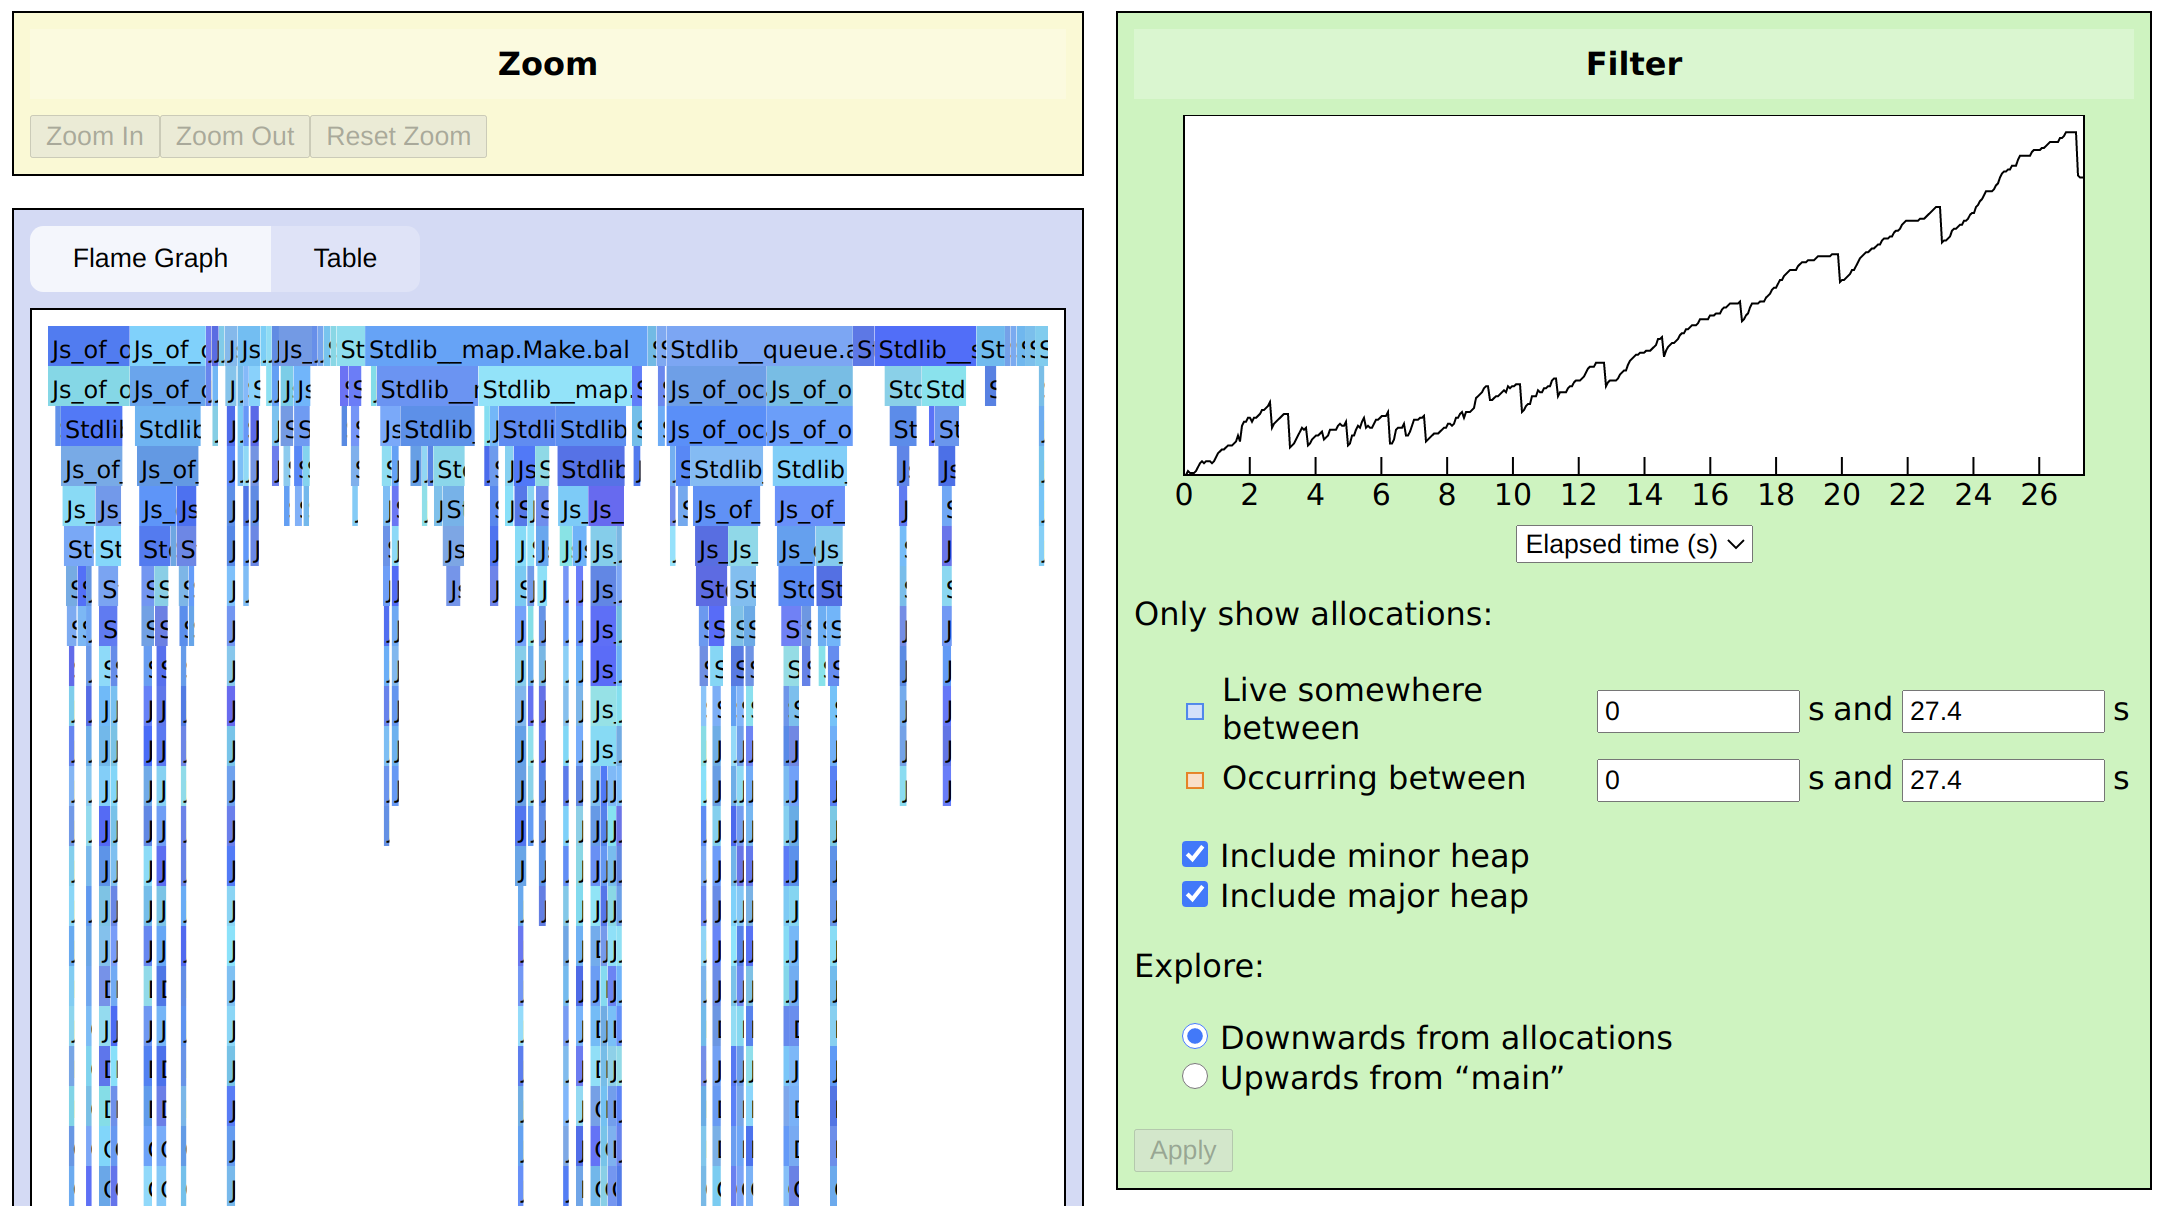
We can start by again looking at what’s live at the end of the program, by using Live somewhere between to select a range:
We can see that most of the memory live at the end of the program was allocated recently. If there were a straightforward memory leak, we’d see lots of allocations from throughout the program that were live at the end, so we can rule that out.
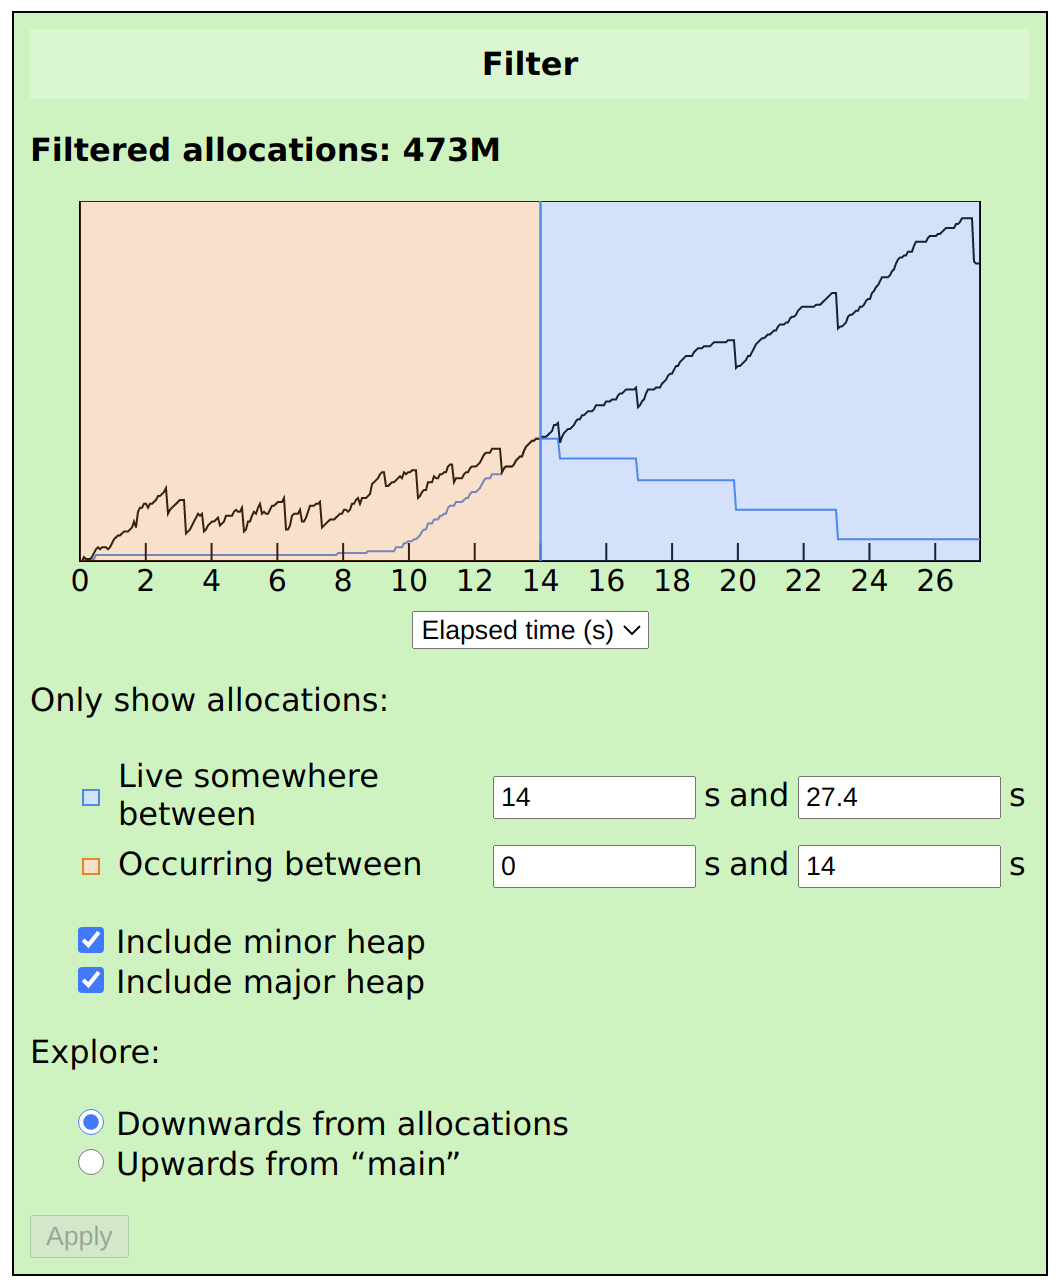
Next, let’s look at somewhere in the middle of the program. If we set Live somewhere between to 14–27.4, and Occurring between to 0–14, then we’ll see a snapshot of the heap at time t=14, showing all of the values that were allocated before that time and live after it:
This is a much more suspicious-looking graph. Notice the steep allocation rate in the blue line before t=14, showing that values live at t=14 were being continuously allocated for about four seconds. All of these values are eventually freed (as shown by the stepped blue line after t=14), but you can see that this line is less steep.
This means that new values are being created faster than they are being consumed. This is a common problem in systems that use a queue to connect components: if the producer outpaces the consumer and no backpressure is applied, then the queue can balloon to larger and larger sizes.
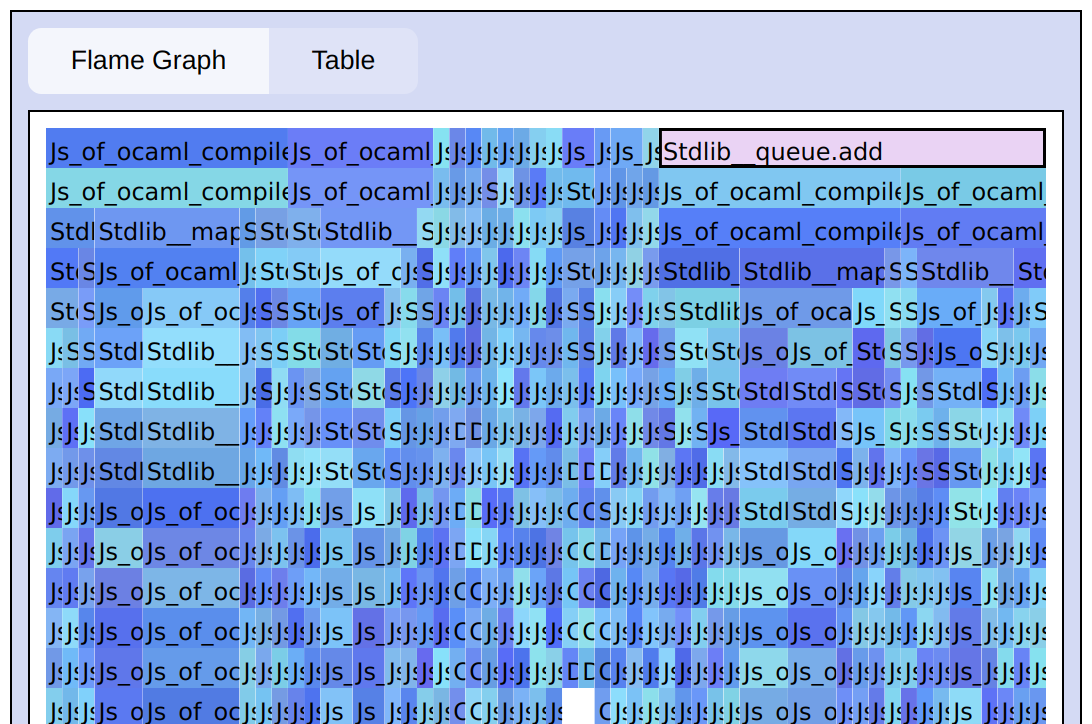
To get a hint as to what sort of values are being created, we can look
at the flame graph. Most of the allocations here are indeed being
created by Stdlib.Queue.add, called by Code.queue_operations
(mouse over the node in the flame graph to see the full name), which
also points to a ballooning queue.
To analyse the queueing performance of our modified js_of_ocaml,
it’s useful to see how the distribution of queued objects’ lifetimes
evolves over time. Queues often contains values that are discarded
shortly after they’re consumed, so the lifetime of a queued item is a
reasonably good proxy for how long it spent queued.
Unfortunately, the Memtrace viewer doesn’t (yet!) have a way to
analyse lifetimes like this. Here’s where writing a custom analysis
will be useful. Let’s focus on allocations
that happen somewhere inside Code.queue_operations. We can detect
these by scanning each allocation’s backtrace for that function name,
and measure its lifetime by subtracting the allocation timestamp from
the collection timestamp.
We need to specially handle allocations that are never collected. Here, let’s count them as being collected at the time the program terminates.
The complete analysis program is:
open Memtrace.Trace
open Base
open Stdio

let print_alloc alloc_time collect_time =
  let alloc_time = Timedelta.to_int64 alloc_time in
  let collect_time = Timedelta.to_int64 collect_time in
  printf
    "%f %f\n"
    (Float.of_int64 alloc_time /. 1_000_000.)
    (Float.of_int64 Int64.(collect_time - alloc_time) /. 1_000_000.)
;;

let () =
  let trace = Reader.open_ ~filename:(Sys.get_argv ()).(1) in
  let allocs = Obj_id.Tbl.create 20 in
  let last_timestamp = ref None in
  Reader.iter trace (fun time ev ->
    last_timestamp := Some time;
    match ev with
    | Alloc alloc ->
      if Array.existsi alloc.backtrace_buffer ~f:(fun i loc ->
        i < alloc.backtrace_length
        && List.exists (Reader.lookup_location_code trace loc) ~f:(fun loc ->
          String.equal
            loc.defname
            "Js_of_ocaml_compiler__Code.queue_operations"))
      then Obj_id.Tbl.add allocs alloc.obj_id time
    | Collect id when Obj_id.Tbl.mem allocs id ->
      print_alloc (Obj_id.Tbl.find allocs id) time;
      Obj_id.Tbl.remove allocs id
    | _ -> ());
  allocs
  |> Obj_id.Tbl.iter (fun _ alloc_time ->
    print_alloc alloc_time (Option.value_exn !last_timestamp));
  Reader.close trace
;;
This could be made faster: for instance, scanning the whole backtrace and comparing strings on each frame is not efficient. But running it on our example trace takes about 25 ms, so let’s not worry too much.
This outputs a series of (allocation time) (lifetime) pairs, with times
in seconds. Memtrace internally keeps microsecond-precision
timestamps for everything, which is why the numbers are divided by
1_000_000. before printing.
To compile our analysis, you can use Dune with this simple dune file:
(executable
 (name lifetimes_of_queued_objects)
 (libraries base stdio memtrace))
We can view the results by piping into gnuplot:
$ dune build
Done: 29/29 (jobs: 1)
$ _build/default/lifetimes_of_queued_objects.exe js_of_ocaml-queue.ctf | gnuplot -p -e "plot '-'"
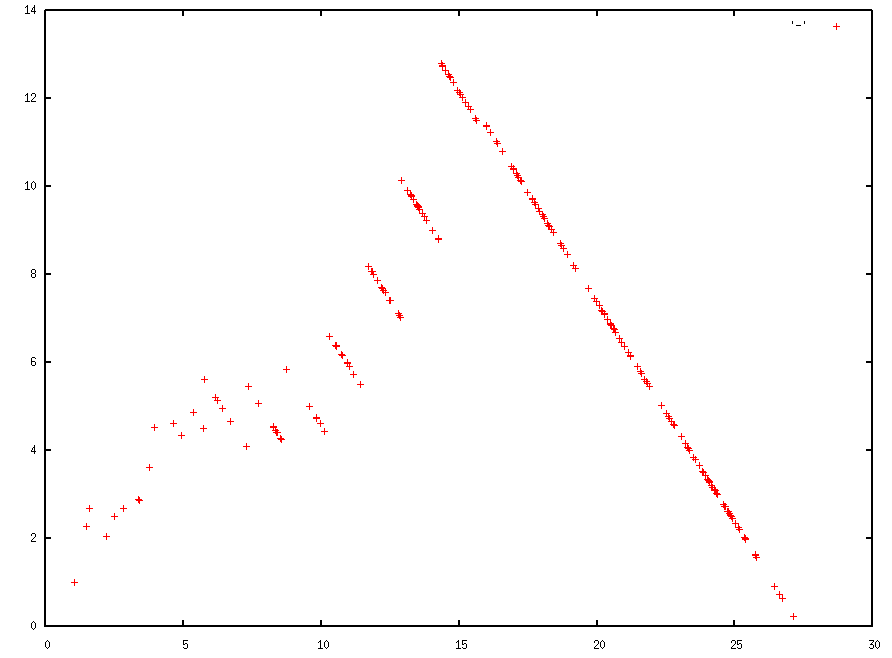
The x-axis is time since program start, and the y-axis is allocation lifetime, both in seconds.
There are lots of downward strokes on this graph. This is an artifact of how GC works: many values allocated over a period of several seconds are collected all at once, giving the ones allocated later a slightly shorter lifetime. This effect is particularly pronounced at the end, where we deemed all of the uncollected values to be collected right as the program ended.
Nonetheless, we can clearly see a backlogged queue here. The time taken to process a queue item starts low, but grows steadily over time. At the peak (t = 15 or so), items are taking over 12 seconds to be processed.
The future
This is still a new project. Features we’re working on for the Memtrace viewer include more sophisticated filtering, including filtering by module, and the ability to operate on data streamed from a live process. We’re also eager to see what other analyses and visualizations people come up with using the Memtrace library.
If you have any problems with the library or the viewer, or if you have an idea for how to make them better, let us know by filing an issue on GitHub (library, viewer).


