Spacetime is a new memory profiling facility for OCaml to help find space leaks and unwanted allocations. Whilst still a little rough around the edges, we’ve found it to be a very useful tool. Since there’s not much documentation for using spacetime beyond this readme, I’ve written a little intro to give people an idea of how to use it.
Generating a profile
As an example of Spacetime in action let’s get a profile for the js_of_ocaml
compiler. First we’ll need a Spacetime-enabled OCaml compiler:
$ opam switch 4.04.0+spacetime
$ eval `opam config env`
Using this compiler we build the executable. In this case we just let opam build it for us:
$ opam install js_of_ocaml
Now we run the executable, using the environment variable
OCAML_SPACETIME_INTERVAL to turn on profiling and specify how frequently
Spacetime should inspect the OCaml heap (in milliseconds).
$ OCAML_SPACETIME_INTERVAL=1000 js_of_ocaml core_kernel.cma
Executables with Spacetime enabled run more slowly and use more system memory than usual, but the contents of the OCaml heap should be unaffected.
Running the executable produces a file in the current directory:
$ ls | grep spacetime
spacetime-8045
8045 was the pid of the process. If your executable forks then there may be multiple Spacetime files.
Now that we have a Spacetime profile, we need to install the prof_spacetime profile viewer:
$ opam switch 4.04.0
$ eval `opam config env`
$ opam install prof_spacetime
Next we process the profile:
$ prof_spacetime process -e .opam/4.04.0+spacetime/bin/js_of_ocaml spacetime-8045
Processing series...done

$ ls | grep spacetime
spacetime-8045
spacetime-8045.p
This can take a while – a couple of minutes in this case. The -e option is
used to pass prof_spacetime the executable that produced the profile. This
option is not strictly necessary, but without it the profile wouldn’t include
locations for C code.
Web viewer
Now we are ready to look at the profile, we’ll start by using the web viewer:
$ prof_spacetime serve -p spacetime-8045.p
Processing series...done
Serving on 127.0.0.1:8080
Live words
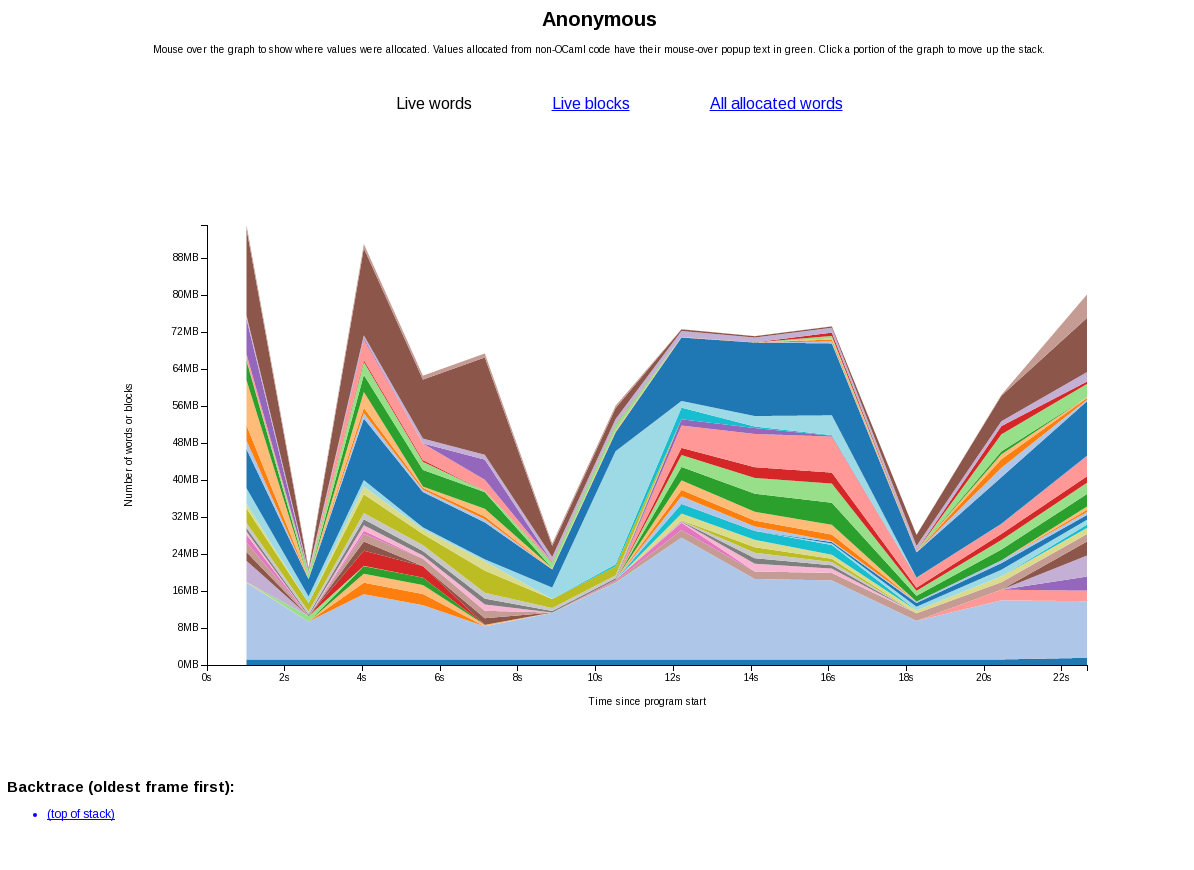
Navigating to the appropriate address in a browser, we are greeted by an exciting colourful graph:
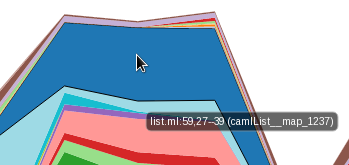
This graph shows the number of live words in the program over time, divided up by the source location at which the words were allocated. If we place our mouse over a section of the graph it will display the source location for that section:
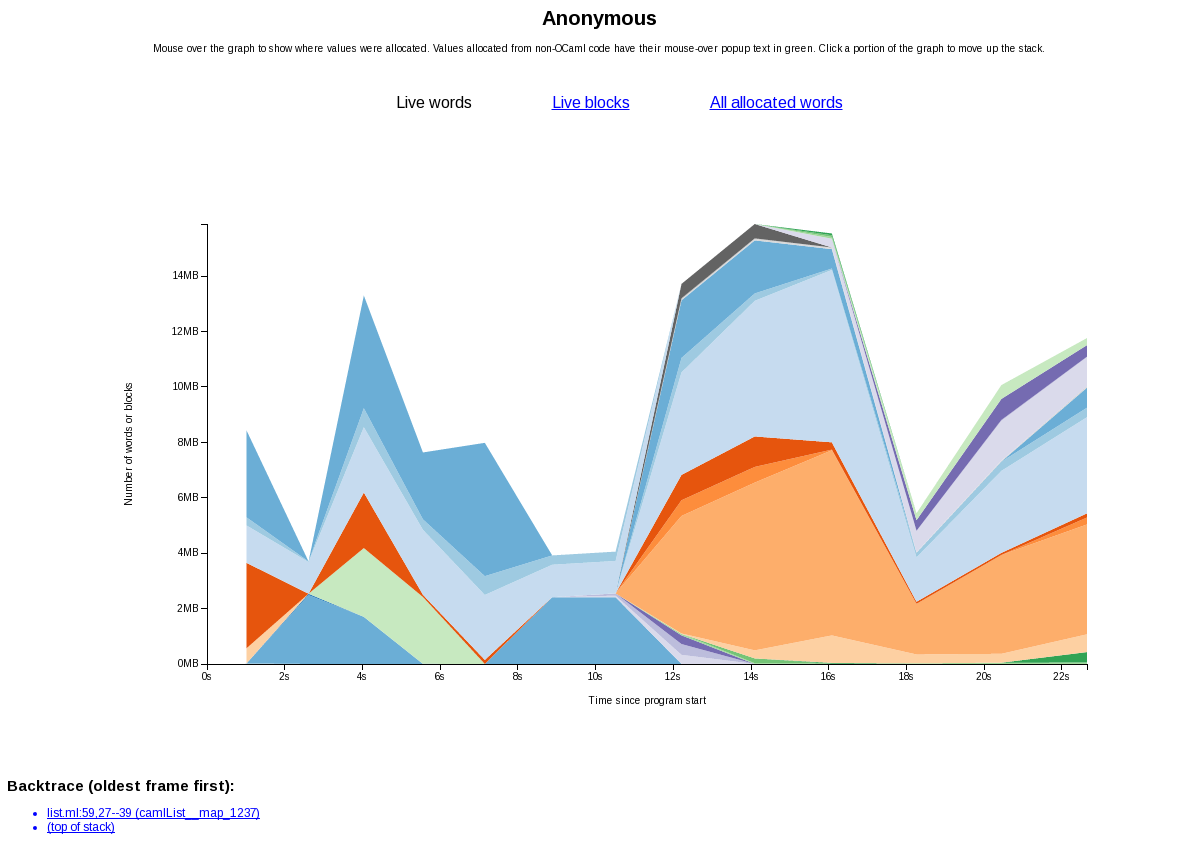
and by clicking on a section we are taken to a new graph:
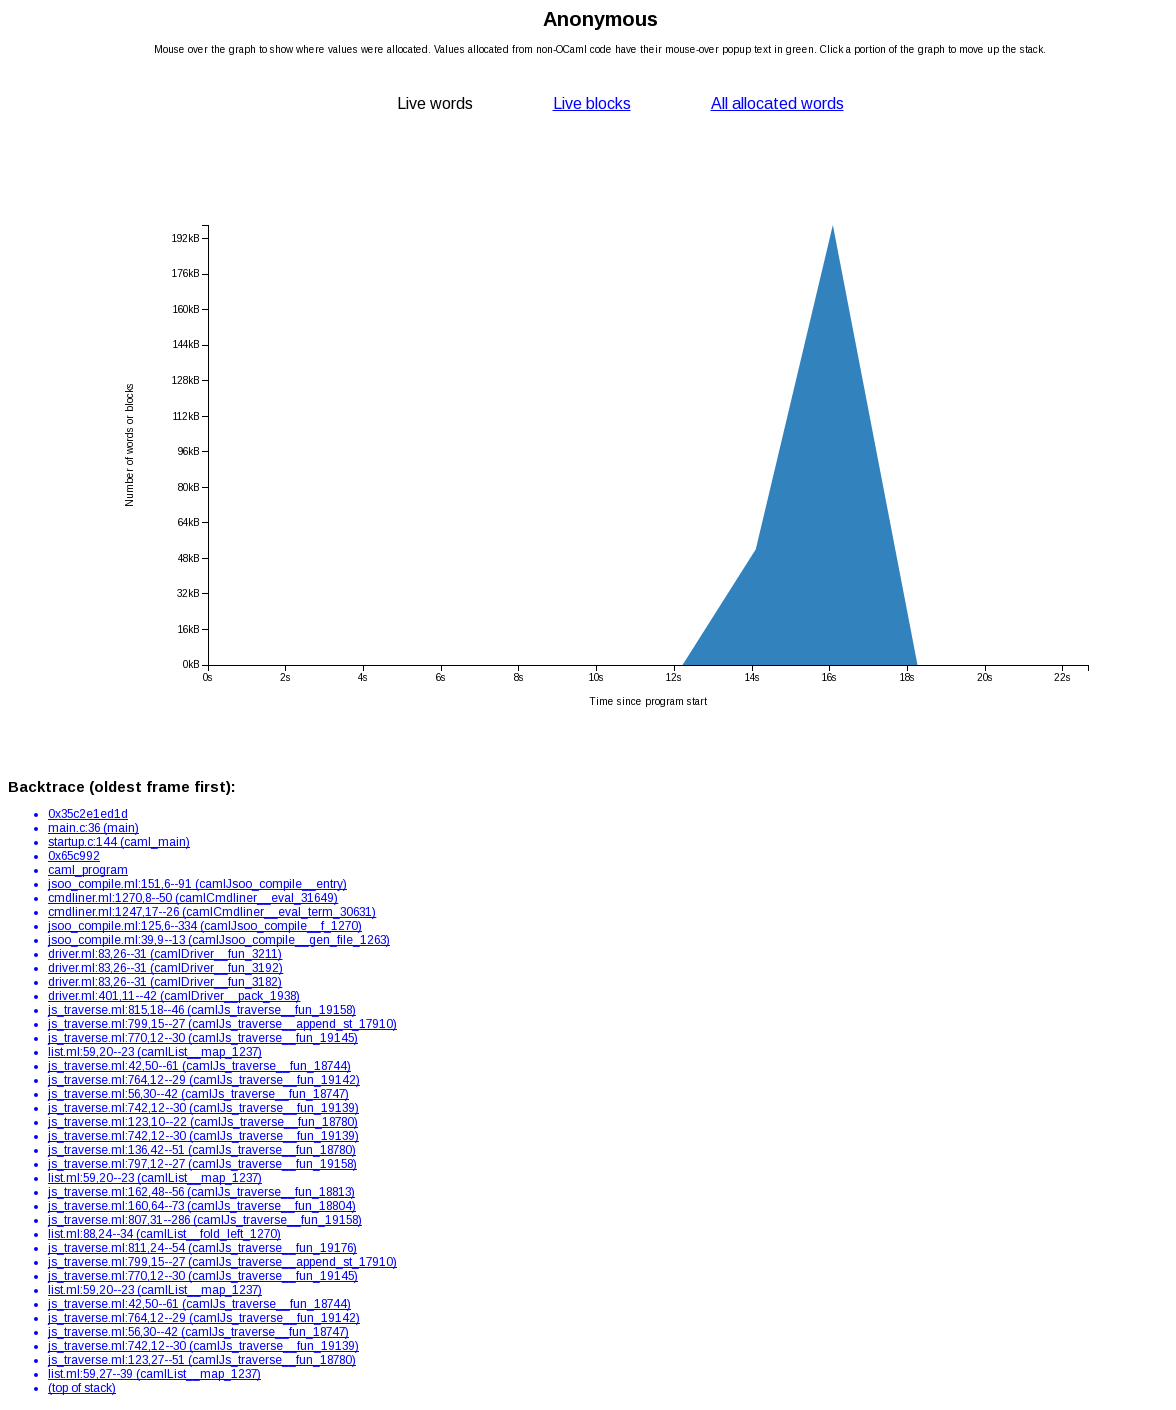
This graph contains only those live words allocated at the clicked source location. It is divided up by the source location of the call to the function which performed the allocation – i.e. the next frame up the backtrace. This is a key feature of Spacetime: not only can you see that these words were allocated by List.map, you can see which call to List.map allocated them. By continuing to click on these graphs we can get the entire backtrace when some words were allocated:
Clicking on the (top of stack) link returns us to the original graph.
Allocated words
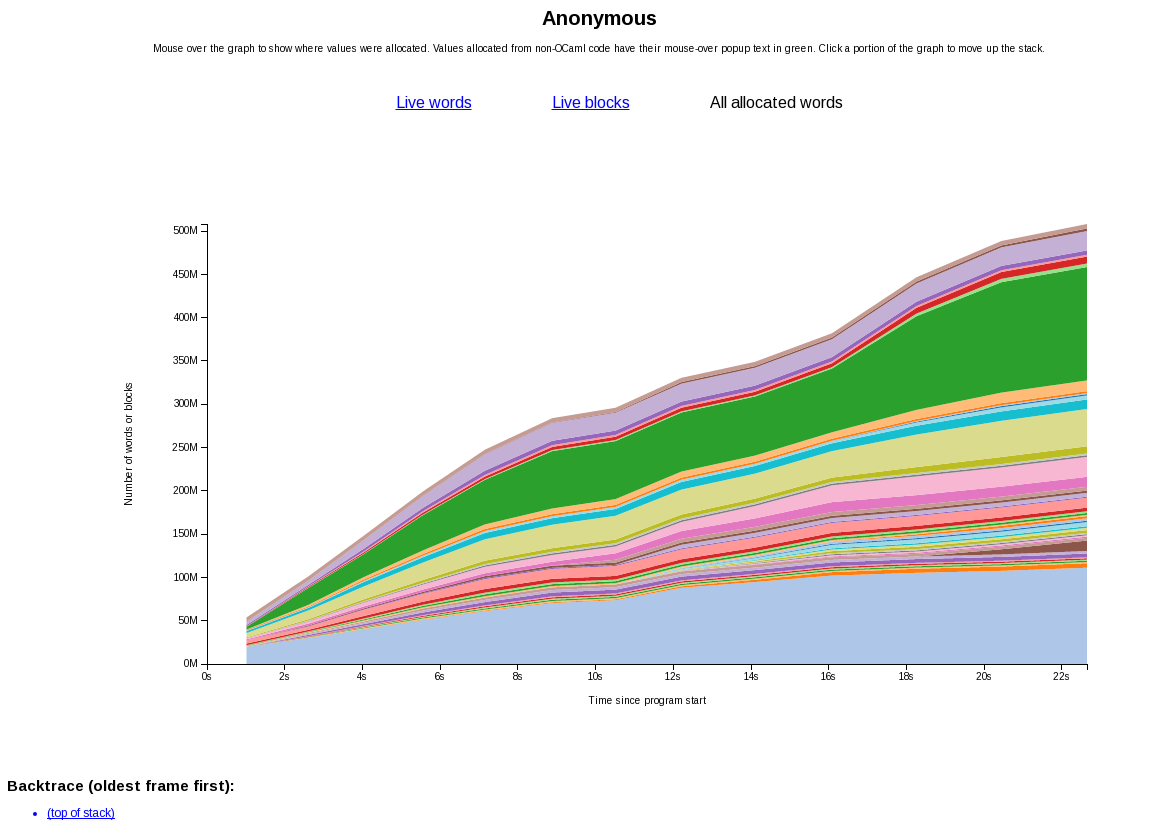
The live graphs (“Live words” and “Live blocks”) are useful for locating space leaks. For removing unwanted allocations, the allocation graph is more useful. By clicking the “All allocated words” link we are shown a new graph:
This graph shows the cumulative total of allocations in the program, divided up by the source location of those allocations. Holding your mouse over a section will display the location of that section. Clicking on a section will take you to a new graph containing only the allocations from that section, divided up by the location of the next frame up the backtrace.
Terminal viewer
Now we’ll try the terminal viewer:
$ prof_spacetime view -p spacetime-8045.p
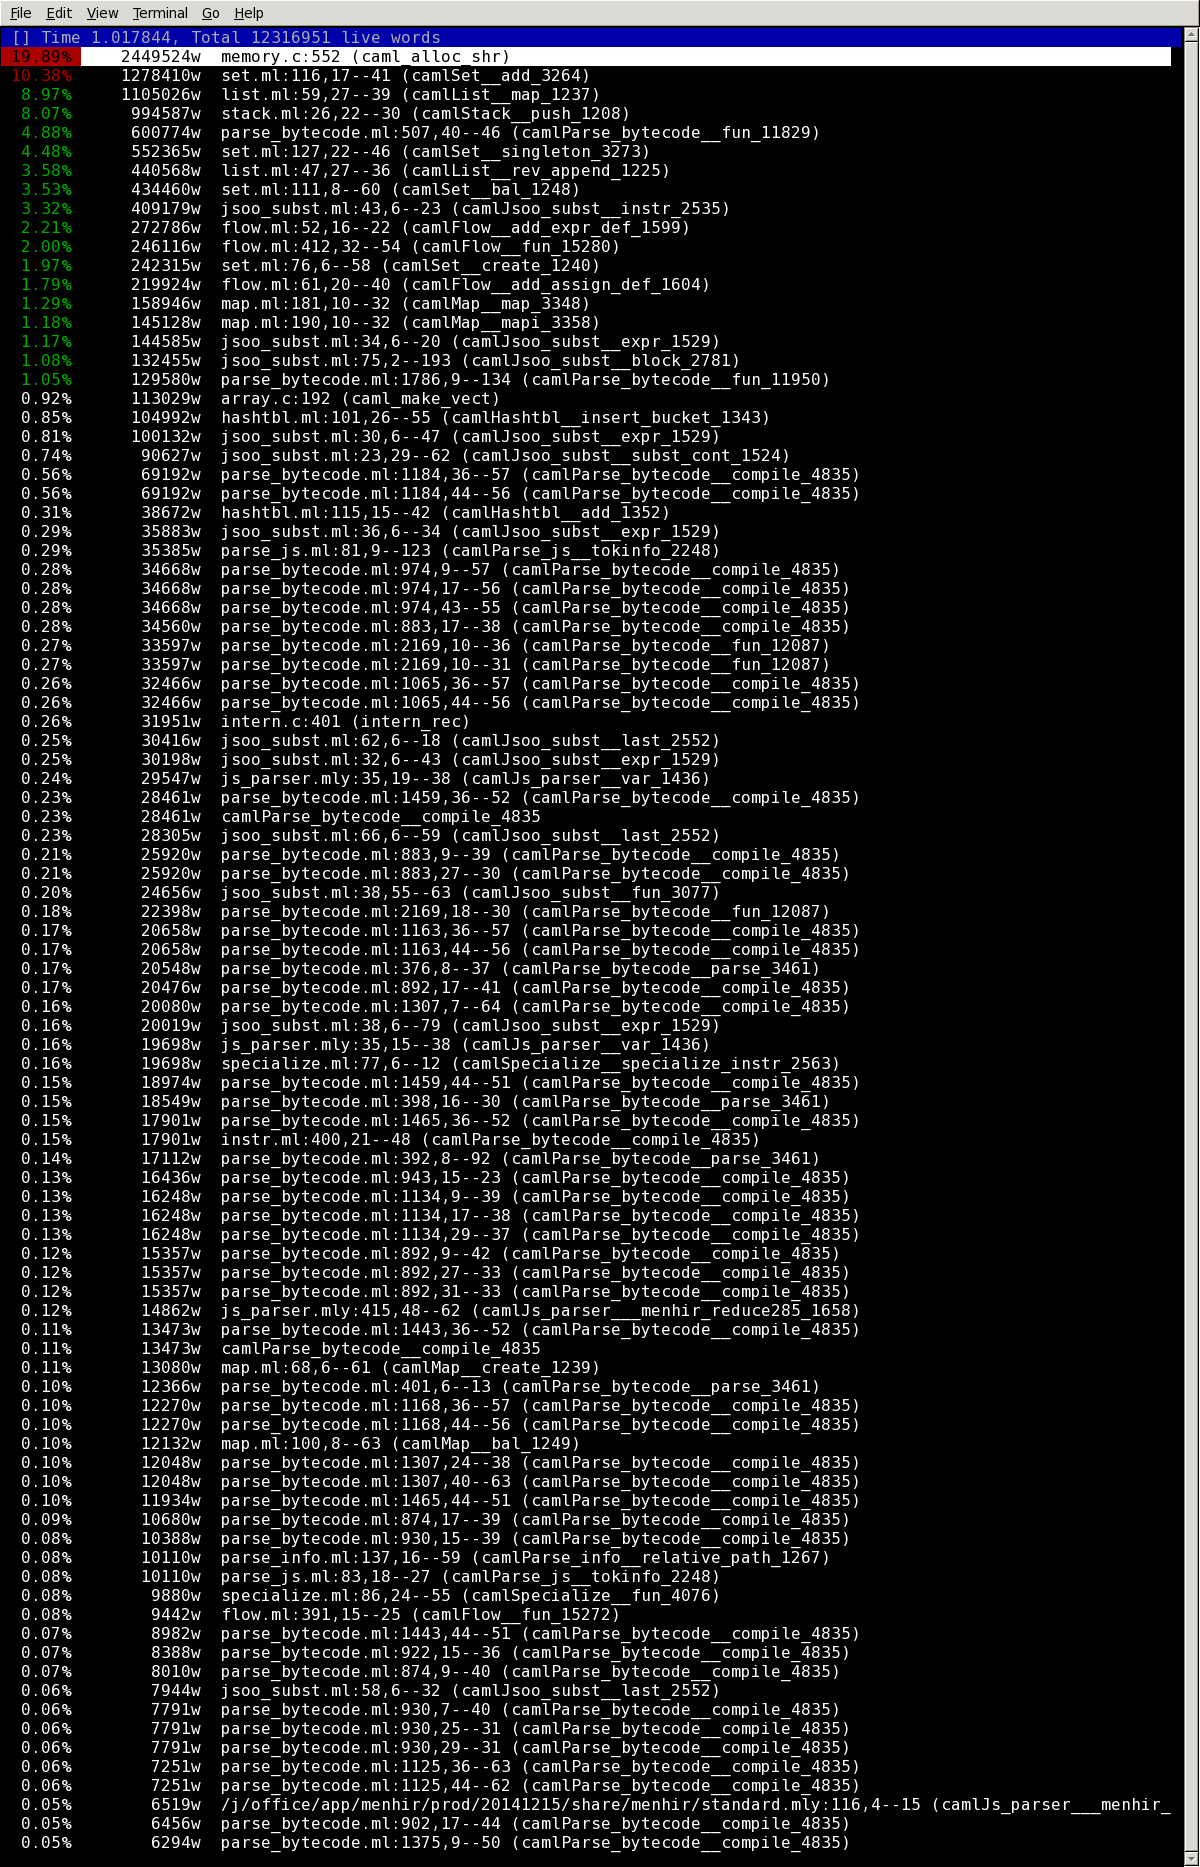
which launches us into a lambda-term style terminal view:
This shows the live words at a particular time (1.017844s) in the program’s
execution divided up by the source location at which the words were allocated.
The ← and → keys move between different points in time. The ↑ and ↓ keys select
different rows. Pressing return on a row loads a new view:
This shows the live words allocated at the selected source location (memory.c:
552) divided up by the source location of the call to the function containing
the allocation – i.e. the next frame up the backtrace. Pressing backspace takes
us back to the previous view.
Finally, pressing tab switches between the three different modes: live words, live blocks and allocated words. Use the q key to exit the viewer.


