This post is meant to be an introduction to Core_bench, our micro-benchmarking library for OCaml. Core_bench is similar to Haskell’s micro-benchmarking library, Criterion, in that it serves the same overall purpose. It is however not a direct port of Criterion to OCaml, but instead employs a different approach to estimating costs that we think yields better results.
We think the result is a benchmarking tool whose results are easier to interpret, and as we’ll see later give us better intuitions as to how much of the time spent by our code can be explained by garbage collection.
Core_bench is also meant to be easy to use. The source is publicly available on
github and the library can be
installed by running opam install core_bench.
Here is an example program that uses Core_bench:
open Core.Std
open Core_bench.Std

let () =
  Command.run (Bench.make_command [
    Bench.Test.create ~name:"id"
      (fun () -> ());
    Bench.Test.create ~name:"Time.now"
      (fun () -> ignore (Time.now ()));
    Bench.Test.create ~name:"Array.create300"
      (fun () -> ignore (Array.create ~len:300 0))
  ])
Let’s ignore the Bench.make_command for a moment and focus on the calls to
Bench.Test.create. Each benchmark consists of a name and a function of type
unit -> unit. When you run the program you see something like:
Name                Time/Run   mWd/Run   mjWd/Run
id                    3.08ns
Time.now            843.82ns     2.00w
Array.create300   3_971.13ns              301.00w
This short program already produces some interesting outputs. It says that the
cost of calling an empty thunk is estimated to be about 3 nanos on my old
laptop. Time.now takes 843 nanos and allocates 2 words on the minor heap due
the fact that it returns a boxed float (one word is 64 bits on a 64 bit
machine). Array.Create300 allocates 301 words directly into the major heap.
The array has length 300 and the one additional word is for the array block
header. Some experimenting shows that Arrays of length 256 or larger are
allocated directly into the major heap.
Bench.make_command gives the program a rich set of command line options. As we
will explain below, Core_bench uses linear regression for estimating the costs.
There are command line options to inspect various error estimates which include
95% confidence intervals calculated via bootstrapping and the goodness of fit,
R\^2, for the
regression. One can also specify the time quota allowed for benchmarking from
the command line. The more data samples the program can collect, the better its
estimates will be. For short-lived functions of the order of microseconds,
benchmarking time of about a second or so produces estimates with pretty tight
95% confidence intervals. If not enough data was collected for a good estimate,
then one would typically see a wide 95% confidence interval.
Micro-benchmarks, like the ones above, estimate the cost of running a small,
independent piece of code. Micro-benchmarking isn’t the right tool for finding
the hot spots in your program – for that you should use profiling tools like
the excellent perf suite for Linux. But it is useful for analyzing the cost of
a given operation. Micro-benchmarking is useful both for designing the bits and
pieces of your libraries, and for building up a rough mental model of the cost
of different operations. All of this is important to do well if you’re going to
write efficient code.
Now that we have a taste of what the library does, let’s turn our attention how it works.
How Core_bench works
Micro-benchmarking is harder than it sounds, for a few reasons. Let’s start by
considering the following naive approach to measuring the execution time of a
function f.
let t1 = Time.now () in
  f ();
let t2 = Time.now () in
report (t2 - t1)
When f () is a short-lived computation, the above t2 - t1 is erroneous for
two reasons:
1: Time.now is too imprecise. The usual resolution of time returned by
Time.now is of the order of 1 microsecond. Consequently the execution time of
f () gets lost in the noise.
2: Time.now is an expensive function that takes a while to execute and
typically requires control transfer to a VDSO. (On my older laptop this takes
800+ nanos to run. On more expensive server class machines, I have seen numbers
as low as 40 nanos.)
The usual approach to minimizing the measurement error of an imprecise timer is
to run f () many times. Thus the pseudo-code becomes:
let t1 = Time.now () in
for i = 1 to batch_size do
  f ();
done;
let t2 = Time.now () in
report batch_size (t2 - t1)
Here we select a batch_size such that the time taken to run the inner loop is
significantly more that the errors inherent in time measurement. To compute the
right value of batch_size, one needs to run Time.now () repeatedly to build
an estimate of both the execution time and the precision of the timing
capabilities of the machine. Subsequently, one needs to run f () repeatedly to
estimate its approximate cost. Once both the estimates are available then one
can select batch_size such that the errors introduced by timing is
significantly smaller (say, less than 1%) of the time taken to execute the for
loop above. Other micro-benchmarking libraries, notably Haskell’s Criterion, do
this.
While the above strategy compensates for timing errors, it does not account for
errors that show up due to system activity. To account for noise in the system,
what Criterion does is that it collects many samples at the selected
batch_size:
for j = 1 to samples do
  let t1 = Time.now () in
  for i = 1 to batch_size do
    f ();
  done;
  let t2 = Time.now () in
  report batch_size (t2 - t1)
done
Once the samples have been collected the mean, standard deviation and various other stats can be reported to the user. If there was any significant system activity while the benchmark was running, the affected samples will show up as outliers in the data set. Criterion additionally provides several nice visualizations to the user such that the user can see outliers caused by system noise and such. See the following blog entry about the design of Criterion.
So are we done? It turns out that a straightforward implementation of the above
in OCaml results in benchmark numbers that show a large amount of variance
between runs. A major source of this variance is due to the delayed cost of GC.
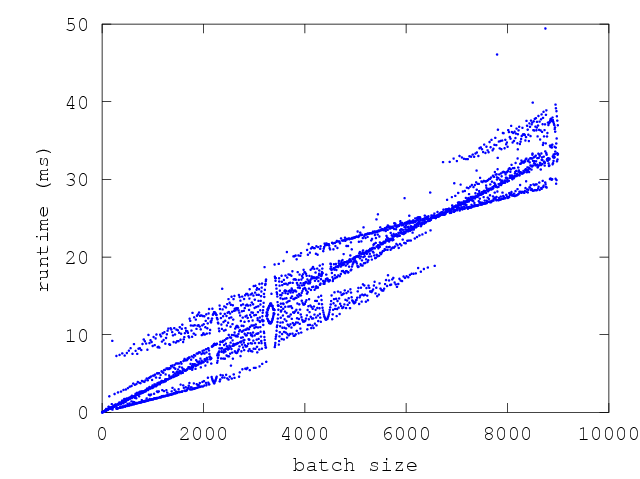
To understand this better, consider the graph below which is a plot of execution
time versus batch_size:
The above graph corresponds to repeated sampling of the following f at various
batch sizes:
let f () = ignore(Array.create ~len:300 0)
In this graph, the y-axis shows time taken per sample and the x-axis is the
batch_size of the sample. The wave-like pattern that emerges here is due to
GC. There are points along the x-axis where the execution time is clearly
bi-modal or tri-modal, while there are points where there is very little
variance at all. The points along the x-axis with higher variance correspond to
runs where the f was run enough times that it triggered either n or n+1 GCs
(sometimes n+2) GCs. The points with lower variance correspond to batch sizes
where f triggered almost the same number of GCs in each sample.
The interesting thing to note about the above graph is that GC effects have a
periodicity. This periodicity comes from the fact that repeated runs of f ()
allocate memory at a fixed rate. Looking at the graph, it becomes clear that the
execution times of functions that allocate memory are influenced by the choice
of batch size. If we could somehow select batch sizes that had low variance then
we could minimize our error estimates. But in general this is not easy since the
shape of the above graph and regions of low variance are specific to the
function being benchmarked. So how can we reduce our error estimates?
Here is the important insight that leads to reducing the error estimates: If we choose any one batch size we might get unlucky and get one with high error estimates or get lucky and pick one that gets us tight error estimates. However if we sample across multiple batch sizes we will tend to smooth this out.
This brings us to how Core_bench works: Core_bench runs f in increasing
batch sizes and reports the estimated time of f () by doing a linear
regression. In the simplest case, the linear regression uses execution time as
the predicted variable and batch size as the predictor. Several useful
properties follow as a consequence:
1: The slope of the regression line represents the time per run of f (). This
is the single most important number we are after.
2: We no longer have to figure out the batch size. We can just start small and increase the batch size untill our time quota runs out. Consequently, we no longer have to estimate the timer function and other such constant overheads. All the constant overheads that are incurred once per sample have the effect of adding a constant overhead to all the samples. In other words, these constant overheads only contribute to the y-intercept given of the linear regression and not to the slope.
3: The same approach extends to estimating memory allocation, wherein we do a
linear regression of minor allocations, promoted words and major allocations
against batch size. Similarly, we can also estimate the number of GCs per call
to f using the same approach. For very cheap functions we would see numbers
such as one minor collection for every 10k runs of f ().
Further, since rate of memory allocation and other such effects are a property
of the semantics of the particular f we are measuring, for making programming
choices it is valuable to have an amortized measure of f that includes the GC
costs and other such runtime costs. In other words, we want to measure f
primarily in terms of batch_size over very large number of runs.
Cumulative effects like memory allocation imply that batch runtimes are not
independant. Expensive batches, i.e. ones where a GC has occurred, tend to be
followed by relatively cheaper batches (since there is more free memory
available and hence less GC pressure). To try to measure larger batches for the
same amount of sampling time, Core_bench geometrically samples batch sizes
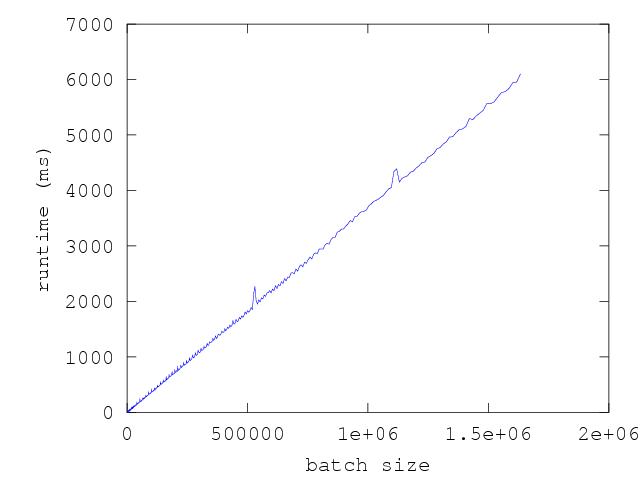
instead of linearly sampling them. The graph below is a plot of the execution
time versus batch size of the same function f with the same amount of total
time spent collecting samples as the previous graph, but with batch size
incremented geometrically:
The resulting estimate of runtime vs batch_size includes the amortized cost of
GC overheads. This amortized cost is valuable in evaluating performance
trade-offs that one might face when comparing multiple design choices of f.
Specifically,
1: If two functions have the same nominal execution time, but one does more allocation than the other, then the one that allocates more will have a higher amortized execution time reported by the regression. This will be reflected as having a higher slope in the time vs. runs graph of the functions.
2: If both functions have similar nominal execution times, but one allocates n words to the minor heap and the other allocates n words to the major heap, the graph above will show a steeper slope for the one that allocates directly to the major heap.
This is the essence of Core_bench and the the above amortized estimate is what it is most commonly used for. This typically gives us a single number that helps us chose between two implementations. It also estimates memory allocation and amortized number of garbage collections caused by functions and this helps us discover ways to structure code such that allocation is minimized. All of this helps us build a mental model of the costs of various operations and hence lets us make better choices when writing performance sensitive code.
Estimating GC costs
A natural extension of the above approach is to use multivariate linear
regression to explain the performance profiles of some functions. Instead of
explaining runtime of functions purely in terms of batch_size as a single
predictor in the linear regression, we can split up the runtime using multiple
predictors such as batch_size, number of GCs and other parameters.
Core_bench has experimental support for this. This becomes interesting for
some functions such as the one below:
let benchmark = Bench.Test.create ~name:"List.init"
 (fun () -> ignore(List.init 100_000 ~f:id))
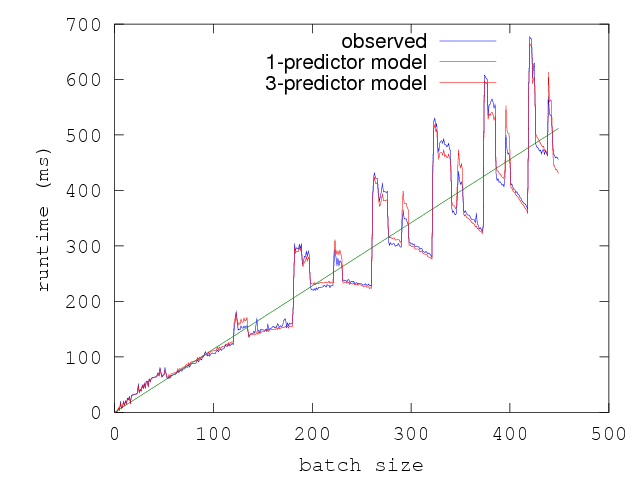
If we plot increasing batch sizes vs execution time of f as we did before,
this function shows a very strange profile:
In some regions of this graph, the execution time taken per batch seems to
decrease as the the batch size increases. Paradoxically, we seem to be taking
lesser and lesser time for more number of runs of f (). In other words, in
some ranges the graph has a negative slope and implying that f () has a
negative execution time. (It is interesting to puzzle out why this function has
this strange execution profile.)
It is clear that the execution time of f () responds to something other than
just the batch_size. Doing a simple linear regression against batch size gives
us the linear slope plotted above. While it gives us a sense of the cost of f,
it really does not explain the time profile. Doing a multivariate linear
regression is interesting in such cases because of its explanatory power:
specifically, it can break down the execution time of f () into component
costs per predictor.
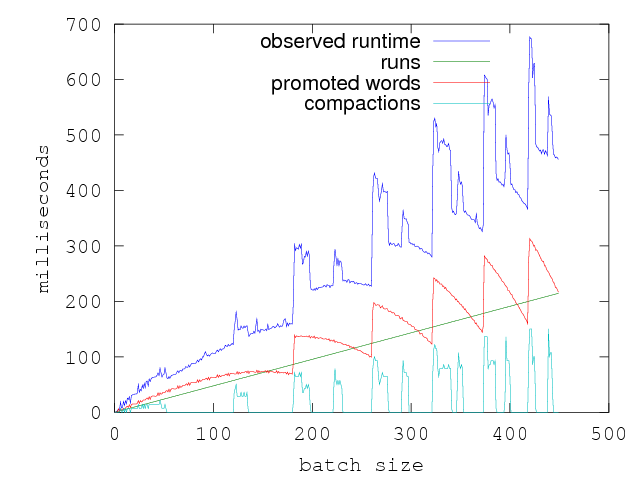
Here is a plot of the execution time of f along with the various other
measures:
Intuitively, one can see that the execution time might be better explained by
linearly combining the batch_size, the promoted words and the compactions.
Doing linear regression with all three predictors results in a much better fit
and a much better explanation of the runtime of f in terms of all the three
aspects of the function that contribute to its execution time.
Though the current version of Core_bench can do such multivariate regressions, this feature is considered experimental primarily because it is difficult for the average user to guess at which predictors might be relevant to the execution time of an arbitrary function. One thing we’d like to do in a future iteration of Core_bench is to have the library automatically search the space of possible predictors and report the most relevant ones. We think it would be interesting to expose values that come from CPU counters such as last layer cache misses and use such values as inputs to such a predictor selection algorithm.
Conclusion
It is worth noting that there is little OCaml specific in the design and the approach should work for other garbage collected languages as well. It would be interesting to see ports of Core_bench to other systems and see what it teaches us about the performance characteristics of these systems.
In Jane Street we use an accompanying syntax extension that allows us to define
micro-benchmarks inline in .ml files, much like we do with unit tests. Having
inline micro-benchmarks allows us to generate performance numbers from our main
libraries and to track performance regression over time. Much of the work for
the syntax extension and related reporting infrastructure was done by Sebastian
Funk from Cambridge University who interned in summer of 2013. At the time of
this writing Core_bench produces pretty stable estimates of execution costs of
functions and is being used actively in development. We hope you’ll find it
useful in developing valuable intuition for writing performance sensitive code.

